Abstract
Data storage has become an increasingly significant issue with the widespread availability of cheap storage technology and the development of global data centres for cloud storage. This paper reports a study of energy consumption for data storage in data centres. Unlike previous estimates, which have been extrapolations of broad energy usage within the data centre, we take a bottom-up approach. Firstly, we describe the technologies that can be used for data storage. Then we build up a model of energy consumption in data centres based on tiers of data storage. Based on published forecasts of data storage growth and assumptions about improving energy efficiency in technology and data centres, we then estimate the energy consumption for data storage in data centres in 2020. We show that energy consumption will rise substantially if a ?business as usual? approach is adopted. We further show that the growth in energy consumption can be mitigated somewhat by adopting a more aggressive policy of data archiving on long-term, low-energy, ?cold? storage; or more ideally purging data of little or no future value. This, however, would require a change in the popular assumption that data will be available readily online and forever.
Introduction
The popularity of cloud computing, the development of ?big data? analysis and the Internet of Things have led to an explosion in the generation and storage of data. In 2010, the world entered an era in which the amount of data stored in the digital universe, global data stored on all devices, exceeded 1 zettabyte (that is, 1x1021 bytes) (IDC 2011a). Subsequent analysis by IDC (2014a) has estimated that the amount of data stored surpassed 4.4 zettabytes (ZB) in 2013. For the future, estimates vary but all predictions are for rapid and exponential growth in storage. IDC foresees the digital universe increasing by ten times between 2013 and 2020, with a predicted 44 ZB of data stored by 2020.
Another paper in this issue (Zwolenski 2014) describes what is driving this remarkable growth in data storage. Our concern here is with the technologies used to provide data storage and their likely evolution that could limit the amount of energy required for storage. We expect that, even with an optimal mix of technologies, total use-phase energy for storage will continue its inexorable rise given the ever-increasing demand. Better data handling can go some way to mitigating the increase in demand, which is the subject of a third paper (Lambrechts 2014) in this issue.
The rise of large, modern data centres has been generally beneficial for energy efficiency. For enterprises, relatively small and inefficient data centres can be replaced by very large, shared data centres. In the consumer market, the growth in end-user personal storage is slowing and one can envisage that most end-user storage in the future will be in the cloud (Gartner 2012). It is estimated (Seagate 2014a), for example, that in 2010 62% of data storage products were destined for end-user devices, while the prediction for 2020 is that 61% of data storage will, by contrast, be delivered via cloud applications.
Very large data centres can concentrate the effort to drive greater energy efficiency. Such efforts will, however, be limited by the technologies available for storage. This paper is concerned with the storage technologies, their use-phase energy consumption, and their likely evolution. We first outline the available storage technologies and describe their energy use. We then consider the future mix of technologies that could be used to provide a more energy-efficient future for data storage. We show, however, that even with a judicious mix of technologies for online and offline (or cold high latency) storage, total energy use will continue to rise rapidly if the demand for storage continues as predicted. We conclude with some remarks about sustainability of storage solutions into the future.
Storage Technology
One reason that storage has become ubiquitous is that it is readily available and cheap. In the period from 1956 to 2005, the storage density of a hard disk drive increased by 50 million times (Walter 2005), a year-on-year increase of 43.6%. In 1956, an IBM 5 MB hard disk drive cost US$ 50,000 and weighed over 1000 Kg (Komorowski 2014) ? see Figure 1.

Figure 1: A 5MB IBM hard disk drive is loaded onto an aeroplane in 1956
Source: https://twitter.com/HistoricalPics/status/419449414533783552/photo/1, retrieved 28 July 2014
Today, a 3 TB hard disk drive costs about US$ 100, or about US$ 0.03 per GB. A graph of hard disk drive cost, plotted on a logarithmic scale in Figure 2, shows the ?precipitous drop in prices that has occurred over the last 35 years of innovation and increasing storage demand? (Komorowski 2014).
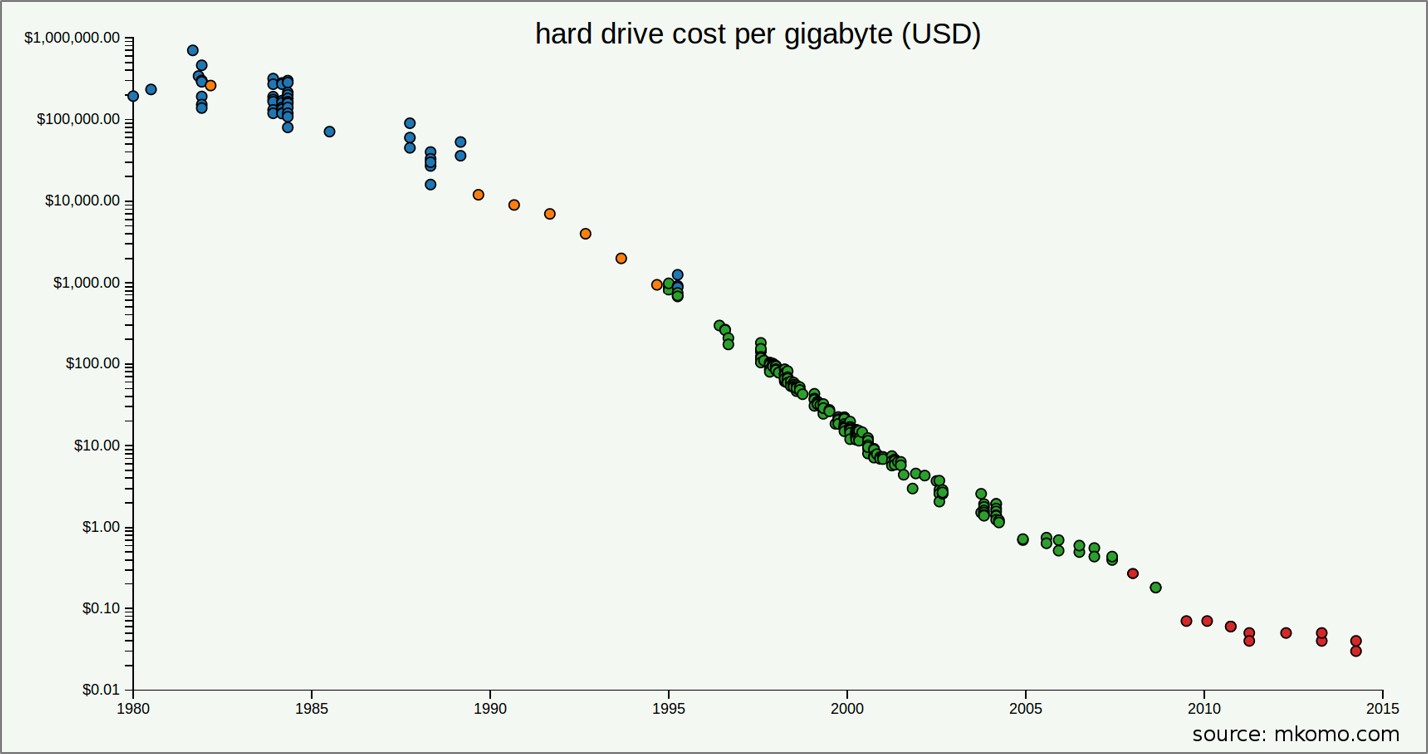
Figure 2: A History of HDD Data Storage Costs
(reproduced with permission - Komorowski 2014)
In this section, we describe the most common data storage technologies and outline their energy requirements.
Hard Disk Drives
Hard Disk Drives (HDDs) have been the mainstay of data storage for more than 50 years. A HDD includes spinning disk platters that are magnetically written to and read from via heads moving across the platter surfaces. HDDs have three key components requiring power ? the spindle motor, the read/write head control and the device electronics (central processor, cache memory, input-output (IO) interface). Of these, the spindle motor consumes the largest amount of energy especially when spinning up from a stopped state. HDDs have a range of possible power states that include parking the head activity, stopping or slowing down the spindle motor, and ultimately shutting down the device electronics (no IO possible). Where a spindle motor has been turned off, it can take up to 10 seconds or more for the hard disk drive to resume normal operations.
HDD spindle speeds are typically 4,800, 5,400 or 7,200 revolutions per minute (RPM). To reduce rotational latency (time for the right information to spin around underneath the head), high performance enterprise hard disks often spin at 10,000 and sometimes 15,000 RPM. HDDs with lower spindle speeds and smaller platter sizes require less power to be drawn by the spindle motor. Reducing the HDD physical size from 3.5-inch (8.89 cm) format to 2.5-inch (6.35 cm) format can provide a 45% to 50% reduction in power usage for equivalent spindle speeds and performance, but cannot offer the same energy use per storage (in W/TB) and per physical equipment rack storage density.
Both Seagate and Western Digital have recently commercialised 6 TB 3.5-inch HDDs. Costing US$ 600 to US$ 800, they are currently 3 to 4 times more expensive per TB to purchase than 3 TB HDDs. Nonetheless, 6 TB HDDs do offer twice the data density and approximately half the W/TB of 3 TB units. The price of 6 TB drives will no doubt decline as manufacturing scale and demand increase.
The latest Western Digital (HGST 2013) 6 TB 3.5-inch HDD is the first commercial HDD that is hermetically sealed with helium, rather than air (Electronista 2013). The use of helium (being lighter than air) reduces internal turbulence caused by the spinning platters and, as a result, saves power and lowers the operating temperature. When configured with a SAS 6 Gb/s interface, it typically consumes 8.8 W (1.467 W/TB) when active at 7,200 RPM and 5.7 W (0.95 W/TB) when idle. As at June 2014, Amazon.com pricing is about AU$ 750 ? or AU$ 125/TB.
Seagate?s equivalent Enterprise 6 TB HDD (with a SAS 12 Gb/s interface) has a specified power consumption of typically 11.9 W (1.98 W/TB) when active at 7,200 RPM and 8 W (1.33 W/TB) at idle (Seagate 2014b). As at June 2014, Amazon.com pricing is about AU$ 725 ? or AU$ 121/TB.
In August 2014 Seagate (Seagate 2014d) announced the commercialisation of the world?s first 8 TB 3.5-inch HDD for high capacity enterprise and cloud storage applications. At the time of this article?s publication, Seagate was yet to publish pricing and technical specifications, but it is assumed that the W/TB has continued to improve. By 2020, the data storage capacity of a 3.5-inch HDD is foreshadowed to be at least 20 TB (Merian 2013) for similar energy consumption as today?s HDDs.
Solid State Drives
Solid State Drives (SSDs) have no moving parts and therefore generate no sound or vibration. They are comprised of an embedded processor (caching, encryption, data maintenance), non-volatile memory (e.g. flash memory), and IO interface.
SSDs are typically used in three different deployment configurations ? as server installed cache, storage installed cache, and finally as an all-SSD storage array (i.e. no HDDs). Today, SSDs are commonly used for improving the analytics performance on big data sets where the processing of the data is constrained by IO throughput. The cost-optimal deployment configuration for using SSD to improve IO throughput will ultimately depend on the nature of the data analysis. Data that is being repeatedly read can be optimised with server-installed or storage-installed cache. For data sets that are sequentially (rather than recursively) being read, then all-SSD storage may be preferable.
SSD active state power consumption is typically 2 to 3 watts. Idle state (i.e. no IO) power is typically about 1 watt. With a low power consumption and no moving parts there is little heat generated by SSDs. Seagate 1200 SSD (Seagate 2014c) supporting 800 GB and SAS 12 Gb/s interface in a 2.5-inch form factor consumes 4.05 W (5.06 W/TB) when active and 3.0 W (3.75 W/TB) when idle. As at June 2014, Amazon.com pricing is AU$ 2,735 (or AU$ 3,418/TB ? 27 times more expensive per TB than current generation 6 TB HDDs).
Despite the high cost per TB of SSD, it can offer energy reductions and overall cost savings when the delivery of frequently accessed files is a primary deployment requirement. See the EMC example shown in Figure 3.
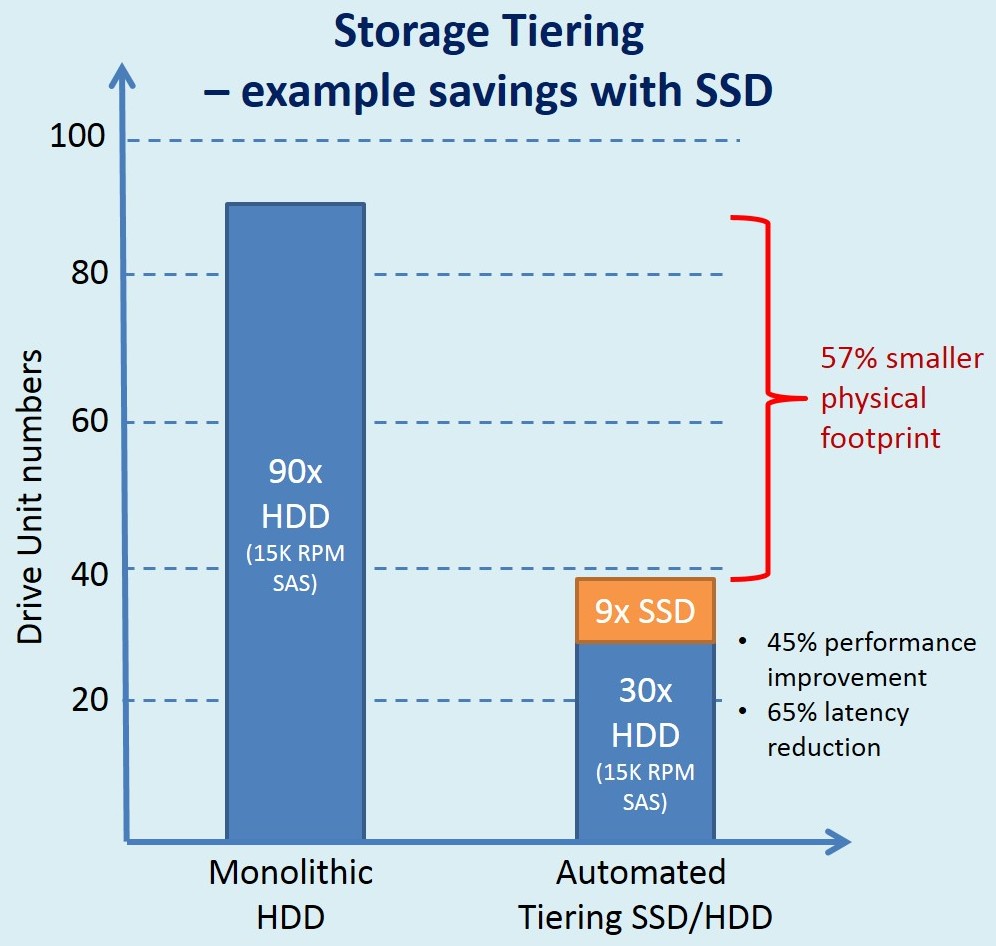
Figure 3: Example of SSD versus High-Performance HDD Performance Savings
(EMC 2012 ? Figure 2)
Solid State Hybrid Drives
Solid State Hybrid Drives (SSHDs) are a relatively new category of data-storage device introduced by Seagate in 2011. They combine the data-density and low cost of the HDD with the performance of an SSD for little more than the cost of a regular HDD. For example, in a data-centre application an SSHD with 32 GB of solid state memory can offer three times the data-retrieval performance of a 15,000 RPM enterprise-grade HDD (Storage Review 2014). Industry testing has shown the Seagate Enterprise Turbo SSHD is currently the world?s fastest HDD. As SSD pricing continues to decline, SSHD technology could be seen as an intermediate gap technology that will extend the life of the spinning hard disk until the price and storage density of SSD perhaps becomes attractive for all applications.
Massive Array of Idle Disks
A Massive Array of Idle Disks (MAID) can be used for short-term storage and staging of backup and archive data. MAID is based on HDD storage arrays where inactive HDD units are ?spun down? to a lower speed or stopped altogether. MAID-enabled storage arrays are suitable for data that needs to be accessed infrequently and can tolerate high latency of accessibility. Given up to 80% of the power drawn by a storage array is consumed by spinning HDD units, powering down inactive HDD units can substantially reduce system power and cooling costs, increase HDD deployment density (saving data-centre floor space), and also prolong the service lifetime of the HDDs. However, when data is requested from a stopped HDD unit, it can take tens of seconds for the HDD to spin up and be ready for access. This has been seen as a significant negative performance impact on MAID 1.0 systems; subsequently, MAID 2.0 has been specified, which implements additional power states that enable disks to be more quickly ?spun up? from slower-spinning states to being fully operational. MAID is a standard defined by the Storage Networking Industry Association (SNIA).
For example, SGI reports (SGI 2010) that its COPAN enterprise MAID storage has a maximum of 25% of HDDs powered at any one time and is therefore at least 75% more energy efficient than traditional, always-spinning HDD storage solutions. It also reports that the service life of the HDDs is extended by more than six times. Where there are industry concerns regarding HDD reliability (e.g. ability to reliably start up after long periods of inactivity), SGI array management software periodically exercises all disks to monitor and maximise HDD health and data storage reliability.
While MAID may extend the service lifetime of HDDs, warranty periods are currently 3 to 6 years and, as such, HDDs can only be considered a short-term (up to 6 years) archival storage solution before the data needs to be migrated to other storage media (or purged).
Magnetic Tape and Virtual Tape Libraries
Magnetic tape data storage is used for data backup and for medium-term (up to 30 years) data archiving. The dominant formats today are LTO (Linear-Tape-Open) and Super-DLT (Digital Linear Tape), which use tape cartridges and auto-loaders to form a large volume tape library. Magnetic tape can experience problems with media degradation (e.g. due to tape spooling) and tape media management (e.g. lost tapes, incomplete backups). There are just two predominant tape manufacturers remaining today, Fujifilm and Sony.
The magnetic tapes themselves use no power when stored in an archive, although there is a small amount of continuing energy use by the tape libraries and systems used for archiving and retrieval. Power is only used, if ever, to retrieve data or to re-write on the tape.
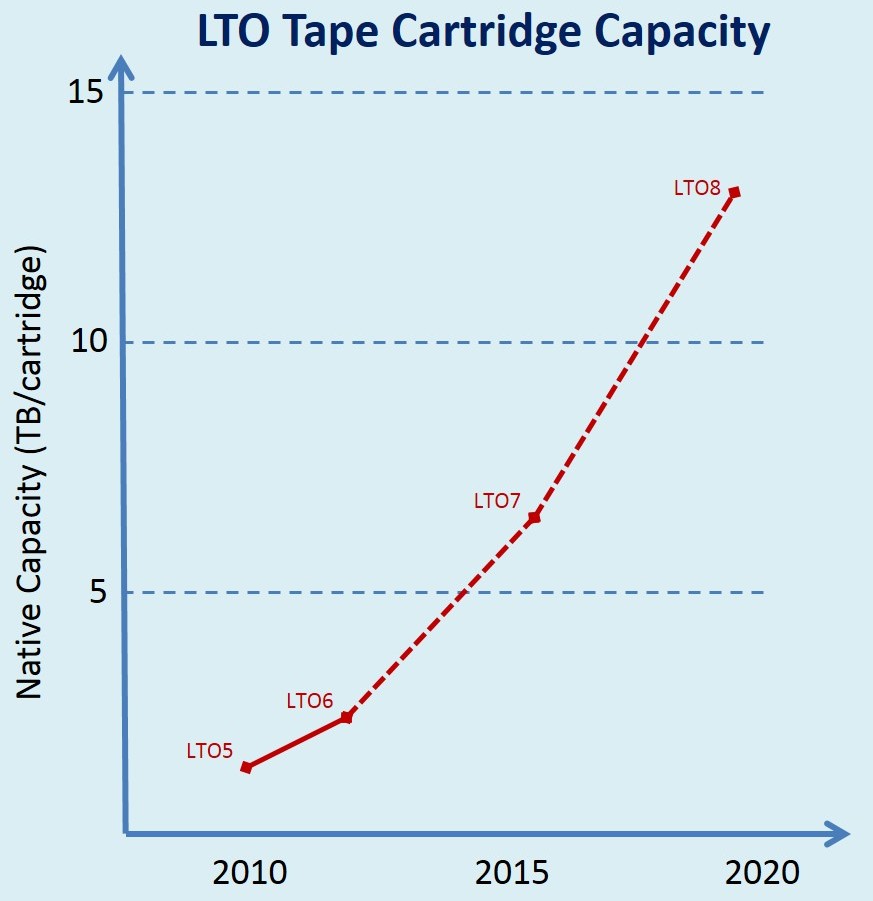
Figure 4: Magnetic Tape Cartridge Capacity Trends
(IDC 2014b)
Rather than using physical tape cartridges, there is some industry move towards Virtual Tape Libraries (VTLs) using HDD storage arrays or as a cloud service. A VTL cloud service simply emulates the physical tape drive functions across a network and can potentially connect to backup and archiving applications provided as cloud storage services. This is an effective means of providing higher performing backup capabilities that shorten data backup processes. While VTLs can be considered a good short-term (up to 5 years) backup solution, they are not able to provide long-term reliable and cost effective archival storage due to the risk of drive motor failure and the difficulties of warehousing the media outside of the data centre.
Optical Disk
Optical disk technologies provide a means to archive data that is infrequently accessed (e.g. in years, if at all) and needing a long lifespan (e.g. 50 to 1,000 years!). Optical storage media is more durable than tape (which needs to be spooled backwards and forwards) and offers greater read performance for the retrieval of individual files. Similar to tape, its relatively low density, portable media format is reliant on robotic, automated media retrieval systems to store large volumes of data and to retrieve it when required. When stored in an archive, optical disks require no power. If the disk is required for reading, power is then consumed as part of the retrieval, reading and replacement in the archive.
Large-scale automated disk retrieval systems are still in development. Most recently, Facebook has developed an open source prototype optical disk storage solution (Broadkin 2014), which uses more than 10,000 100-GB Blu-ray disks to store a petabyte of archival data. This prototype is estimated to be 50% cheaper than HDD archival storage and 80% more energy efficient.
Latest generation BD-XL Blu-ray media is able to store up to 128 GB of data in 4 optical layers on a 120 mm diameter disk (StorageNewsletter 2014a). A higher density format of 300 GB is due to be available in 2015 and 500 GB and 1 TB formats are under development. Compared to current generation magnetic tape, optical disks are lower in physical data density but do offer much greater archival longevity. It is expected that optical disk technology will eventually supersede magnetic tape as the preferred archival data storage media.
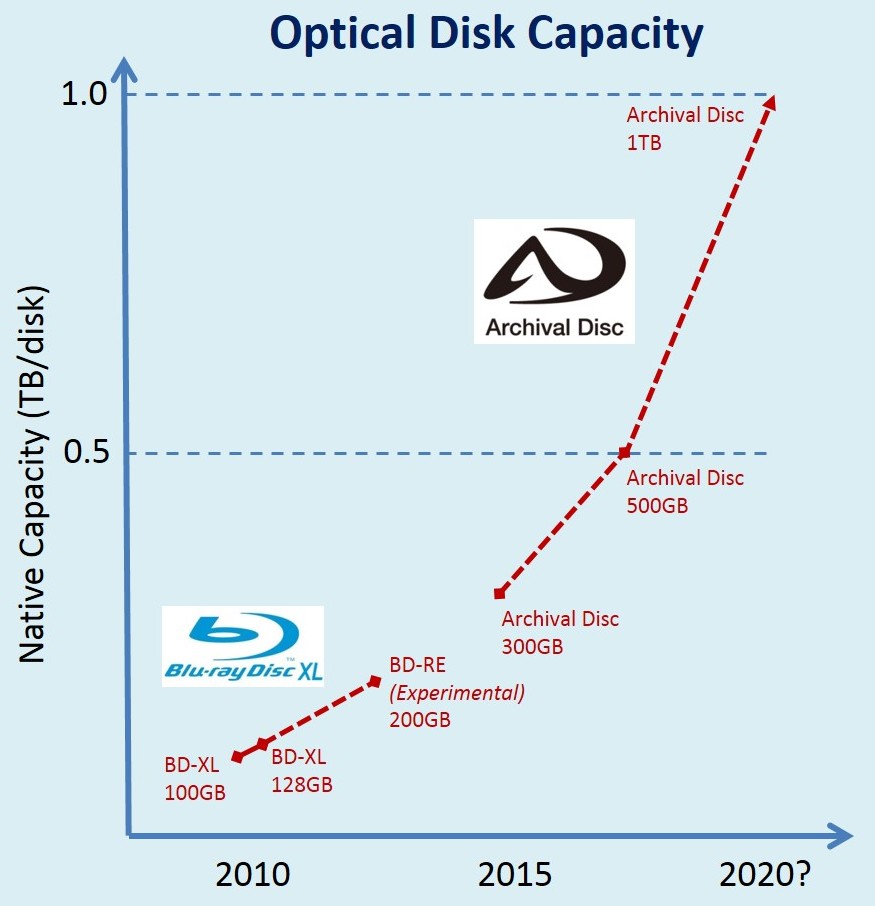
Figure 5: Optical Disk Capacity and Technology Trends
(Storage Newsletter 2014a)
Technology Summary
HDDs will remain the most cost effective, reliable and highest density means to store large volumes of online and near online data for the period to 2020. SSDs, while offering both performance and energy saving benefits (in terms of bytes delivered), will likely remain expensive when compared to HDDs. Beyond 2020, it is possible SSD acquisition costs will approach (but not necessarily be less than) those of HDDs, justifying their general purpose deployment with benefits in performance, physical data density and energy saving.
Storage Tiers
The deployment of storage tiers recognises that the need for data availability depends on the data itself and changes over time. Some data must be immediately available; much active data must be stored where it can be retrieved in milliseconds; and archival data may only require retrieval in days or weeks. Data is often perceived as migrating over time from immediate availability (in tier 0 or tier 1) through intermediate availability (tiers 2, 3 etc.) to archival storage (tier 4). There are a number of definitions of storage tiers (Latamore 2012).
For the purpose of describing energy consumption, we define six tiers of data storage, as follows:
Tier 0.Implemented using SSD, this tier is used for data required near ?instantaneously?. This may be data in a cache or data replicated for on-demand and multi-stream availability.
Tier 1. Implemented using high-performance HDD or SSHD, this tier is also for data required with low latency. The data is most likely cached or replicated from a main data store or may be intermediate storage in an online process.
Tier 2. Implemented using high-capacity HDD, this is where most online business or process data resides. This data is readily available but with higher latency than the lower-numbered, higher performing tiers 0 and 1.
Tier 3. This tier is implemented using MAID or other near-online HDD technologies. The data can be retrieved and made available online but with greater latency of seconds to tens of seconds. Data in this tier has mostly aged and is less likely to be required for day-to-day operations. HDD MAID provides good backup and is an intermediate step towards long-term archive. It is not a replacement for removable media (cannot be moved out of the data centre) and not a medium that is reliable beyond the short term (i.e. the 5 to 6 year lifetime of a HDD).
Tier 4. This tier is implemented in removable media such as tape or optical disk. It can be retrieved in minutes or longer, either by robotic systems or human intervention. The data is essentially offline until it is required.
Tier 5. This tier is implemented in tape or optical disk. The media have been removed to long-term storage and are not immediately retrievable, but are available as an archive from a warehouse outside of the data centre. Retrieval may take days or weeks.
These tiers are depicted in Figure 6, where it is also noted that:
- The cost of storage increases as one proceeds to lower-numbered (more immediate) tiers;
- Data lifetime and retrieval times increase with the tier number;
- The energy efficiency of the storage technologies generally increases with tier number.
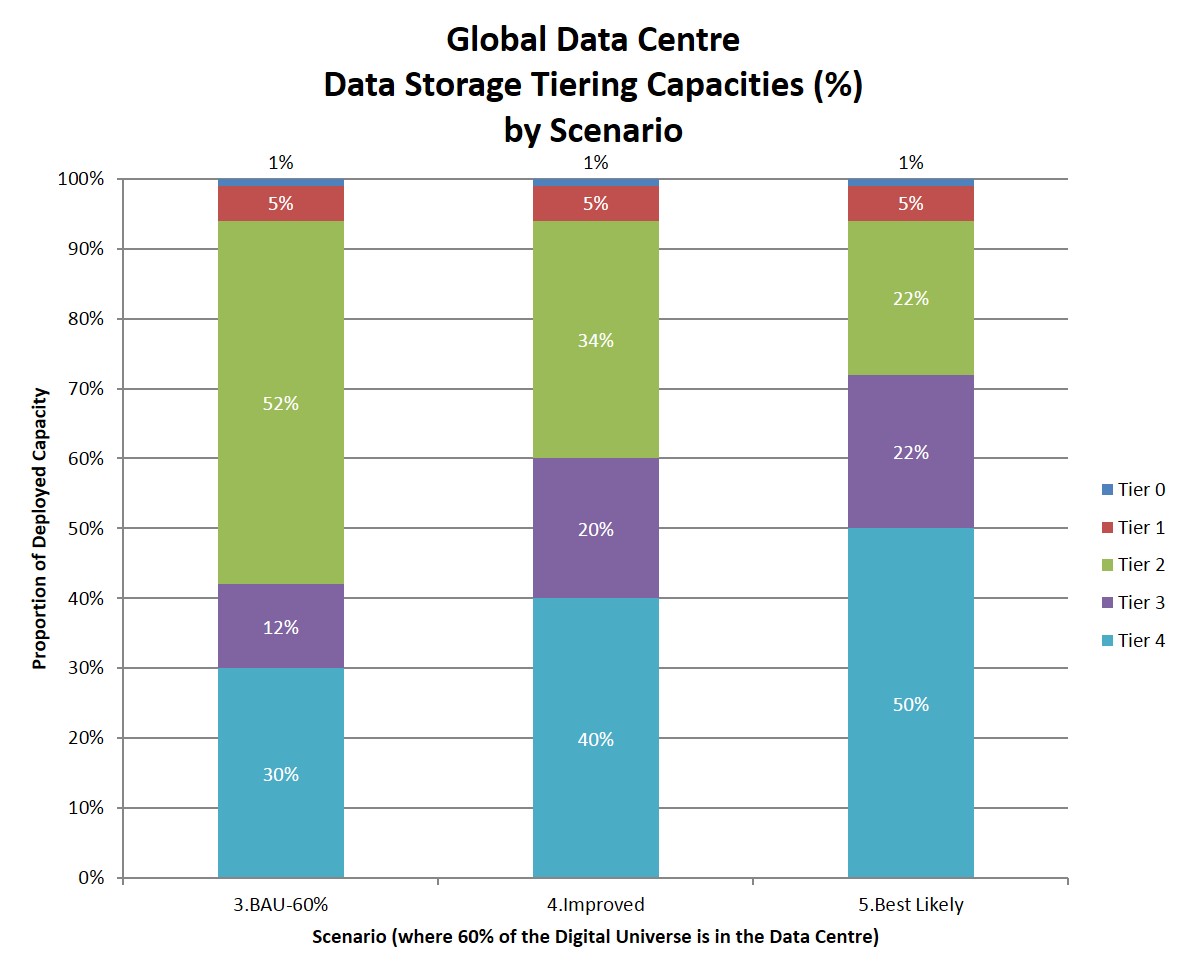
Figure 6: Data Storage Hierarchy
In addition to the storage technology itself, a data centre requires other features, such as a storage system array and associated management processes to catalogue and tag the data. In Table 1, which summarises this study?s estimated energy efficiency of the various data storage tiers, an overhead of 20% of the storage energy has been included to account for these system array and data management overheads.
Table 1: Average Energy Efficiency of Data Storage Tiers for this Study
|
Tier |
2013 |
2020 |
|
|
Average Energy Efficiency (W/TB) |
Average Energy Efficiency (W/TB) |
|
0. SSD |
3.0 |
1.0 |
|
1. Hi-performance HDD |
15.0 |
2.0 |
|
2. Capacity HDD |
12.8 |
2.7 |
|
3. MAID HDD |
3.2 |
0.2 |
|
4. Removable |
0.1 |
0.01 |
Energy Consumption 2013 to 2020
There has been little study and detailed modelling to date of data storage energy consumption in global data centres (GDCs). Data centre studies, such as Koomey (2011) and more recently Van Heddeghem (2014), have used a top-down approach using IDC estimated physical server volumes and data centre Power Usage Effectiveness (PUE ? the ratio of total data centre power to total ICT equipment power) metrics to calculate total GDC energy use. Koomey (2011) acknowledges that data storage, and network, ?are treated at a very high level?. Challenges with further extrapolating Koomey include the continued move of physical compute capacity to virtualised compute capacity. While more applications may be running on the same physical server, there will nonetheless be a greater number of disparate and potentially large data sets not directly aligned with physical server counts or types.
Data centre energy consumption forecasting for the GeSI Smarter 2020 study (GeSI 2012) has used Koomey (2011) as the basis for its 2011 baseline and forecast for 2020. As such, future forecasts of data storage energy consumption have followed the growth in overall data centre energy consumption (or vice versa). While this might be achievable (and desirable), the exponential data universe growth described in EMC (2014) would suggest the future mix of data storage technologies will need to change substantially to include a much larger proportion of offline ?cold? data storage (i.e. tape, optical disk and MAID), in order to avoid significant increases in global data centre energy requirements. A key element of this study is the modelling of GDC data storage capacity in isolation from overall compute capacity growth.
Rather than repeating the top-down approaches, we have worked bottom up, based on the following forecasts:
- The forecast of the total size of the digital universe (IDC 2014a);
- The proportion of this data residing in data centres based on forecast shipped HDD capacity (Seagate 2014a); and
- A varying proportion of data storage technology types within each tier ? in particular the capacity tiers 2 (HDD), 3 (MAID), and 4 (magnetic tape, optical disk).
Our analysis starts by establishing a credible 2013 baseline based on the following assumptions:
- Approximately 40% (Seagate 2014a) of the 4.4 ZB Digital Universe was stored in data centres in 2013;
- 1% of all data centre data storage is SSD;
- 5% of data centre data storage is high-performance HDD;
- 64% of data centre data is stored on capacity HDDs of under 6 TB per unit, but predominantly 2 TB or less;
- 0% (or insignificantly little) of all data in data centres is stored on MAID HDD;
- 30% of all data stored in data centres is stored on removable media (i.e. largely tape);
- An average PUE of 1.65 in 2013 (Uptime 2013) and estimated average PUE of 1.38 in 2020 based on a -2.5% CAGR (GeSI 2012);
- All data forecast in the 2020 Digital Universe is preserved ? i.e. no purging.
From the 2013 baseline, five future 2020 scenarios were developed to test outcomes dependent on the growth of data in the data centre and the data storage technology mix across tiers. The scenarios are described in Table 2.
Table 2: Description of 5 Potential Scenarios for 2020
|
Scenario |
Description |
Global Data Centres |
|
|
|
|
Proportion of Digital Universe in 2020 (%) |
Data Centre Storage Growth 2013-2020 |
|
1. ?Business as usual (BAU) Continues? |
Data centre data storage capacity grows in proportion with overall data growth (i.e. percentage of the digital universe in the data centre does not change). Distribution across technology tiers does not change, excepting some foreshadowed increase in the use of MAID for near-online data storage and backup. |
40% |
1000% |
|
2. ?GeSI 20x? |
Data storage within the data centre grows 20 fold between 2011 and 2020 (GeSI 2012) - i.e. ~818% between 2013 and 2020. Distribution across technology tiers does not change, excepting some foreshadowed increase in the use of MAID for near-online data storage and backup. |
33% |
818% |
|
3. ?BAU 60%? |
Distribution across technology tiers does not change, excepting some foreshadowed increase in the use of MAID for near-online data storage and backup. |
60% |
1500% |
|
4. ?Improved? |
Distribution across technology tiers increases [i] near online (tier 3) data-storage to 20%, and [ii] offline (tier 4) data storage to 40%, of total data centre data storage capacity. |
||
|
5. ?Best Likely? |
Distribution across technology tiers increases [i] near online (tier 3) data-storage to 22%, and [ii] offline (tier 4) data storage to 50%, of total data centre data storage capacity. |
||
Scenarios with lower growth of data centre storage
In the first two scenarios, the data storage capacity of data centres grows at the same rate, or less than, the growth of the digital universe overall.
?BAU Continues? Scenario 1: With GDC data storage capacity growing in line with the overall growth in the digital universe, but still at 40% of the forecast total, total GDC storage power consumption grows from an estimated 15.8 GW in 2013 to 26.8 GW in 2020, an increase of 11.0 GW (or about 11 nuclear power stations): in other words, a 70% increase in power for a 1000% increase in data stored. Compared to the GDC power consumption forecast in the GeSI Smarter 2020 (GeSI 2012) study, data storage power consumption would then be 49% of forecast total GDC power (480 TWh p.a.) and 68% of forecast GDC ICT infrastructure power.
?GeSI 20x? Scenario 2: In this scenario, data storage in data centres grows 20-fold from 2011 to 2020: from an estimated 0.27 ZB of data in data centres in 2011 (40% of 1.8 ZB ? IDC 2011b), through 1.76 ZB in 2013, to 14.4 ZB in 2020. For the period from 2013 to 2020, a further 818% GDC data storage growth would occur, lagging the overall growth (1000%) of the digital universe. We estimate that the percentage of the digital universe in GDCs would decline in percentage terms from 40% to 33% of all data. Compared to the GDC power consumption forecast in the GeSI Smarter 2020 (GeSI 2012) study, data storage power consumption would then be 40% of forecast total GDC power and 58% of forecast GDC ICT infrastructure power. This scenario may come about if data remains highly distributed and the take-up of cloud-based services abates.
We have not estimated the power required to store the data outside data centres. If much of this data were held in offline storage or, indeed, the distribution of data led to an eventual natural attrition of low-value data (through lack of technology migration, reliable backup and no redundancy), then this scenario may be desirable from an energy perspective.
Scenarios with higher growth of data centre storage
Scenarios 3 to 5 all assume GDC data storage growth from 40% of the 2013 digital universe to 60% of the 2020 digital universe. As shown in Figure 7, scenario to scenario we have estimated that there would be a growing proportion of data stored on near-idle (Tier 3 MAID) or idle (Tier 4 removable) storage.
Estimated data storage power is then calculated and compared for each scenario, as shown in Figure 8.
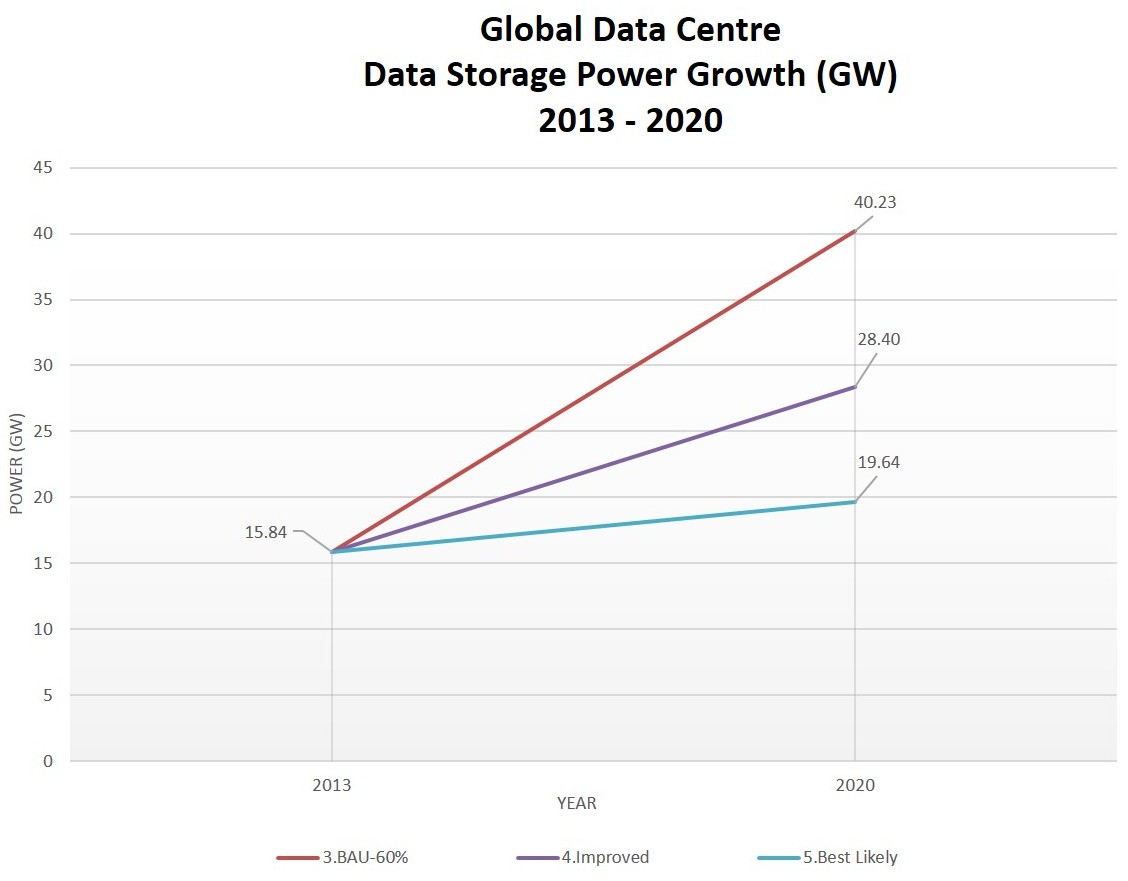
Figure 7: Global Data Centre Data Storage Tiering Capacities by Scenario 2020
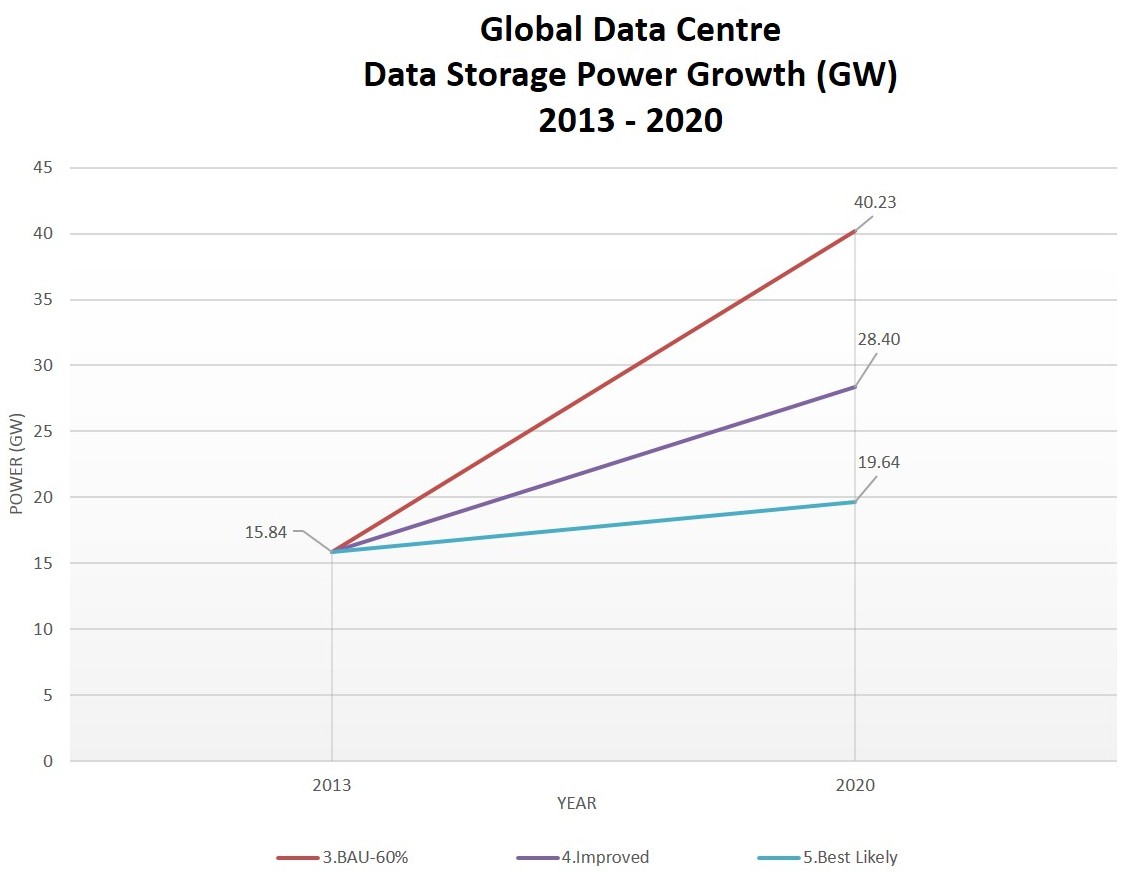
Figure 8: Global Data Centre Data Storage Power Growth by Scenario 2013-2020
?BAU-60%? Scenario 3: With GDC data storage capacity growing up to 60% of the digital universe and the proportion of data stored on idle media unchanged from 2013, total GDC data storage power consumption grows from an estimated 15.8 GW in 2013 to 40.2 GW in 2020, an increase of 24.4 GW: in other words, a 154% increase in power for a 1500% increase in data stored. Compared to the GDC power consumption forecast in the GeSI Smarter 2020 (GeSI 2012) study, data storage power consumption would then be an unrealistic 73.4% of forecast total GDC power (480 TWh p.a.) and 106.6% of forecast ICT infrastructure power. Under this scenario, GeSI Smarter 2020 GDC power estimates would need to be revised substantially upwards.
?Improved? Scenario 4: With GDC data storage capacity growing up to 60% of the digital universe and 60% (20% MAID, 40% Removable) of GDC data stored on idle media, total GDC data storage power consumption grows from an estimated 15.8 GW in 2013 to 28.4 GW in 2020, an increase of 12.6 GW. This would represent a more modest 79% increase in power for the same 1500% increase in data stored. Compared with the GeSI Smarter 2020 (GeSI 2012) study, data storage power consumption would then be 51.8% of forecast total GDC power and 75.3% of forecast ICT infrastructure power. Under this more archive-focussed scenario, GeSI Smarter 2020 GDC power estimates are still expected to be a challenging target and will in all likelihood be exceeded.
?Best Likely? Scenario 5: With GDC data storage capacity growing up to 60% of the digital universe and 72% (22% MAID, 50% Removable) of GDC data stored on idle media, total GDC data storage power consumption grows from an estimated 15.8 GW in 2013 to 19.6 GW in 2020, an increase of 3.8 GW. This 24% increase in power for a 1500% increase in data stored assumes much of the generated data quickly loses its value and is rarely (if ever again) required after a short period of time. Compared with the GeSI Smarter 2020 (GeSI 2012) study, data storage power consumption would then be 35.8% of forecast total GDC power (480 TWh p.a.) and 52.1% of forecast ICT infrastructure power. Under this scenario, which strongly emphasises data archiving, GeSI Smarter 2020 GDC power estimates can be achieved, assuming also that ongoing improvements in compute and network infrastructure energy efficiency will occur. With more data on idle storage, the data management overhead, which itself requires compute and network resources, should also be reduced.
Conclusion
We have shown in this paper that there is some hope for containing the growth in use-phase energy required for data storage in data centres. Our calculations suggest that a ?business as usual? approach would lead to growth in energy use for data storage in data centres of 79% in the face of a tenfold growth (1000%) in total data storage and a continuing growth in cloud storage. On the other hand, if more aggressive data archiving to offline storage were to be implemented, data centre energy for data storage would grow by only 24%. While this is beneficial, it still means that energy use is increasing rapidly, which will eventually be unsustainable.
All these estimates are, of course, hedged about with uncertainty. We have taken as our baseline the IDC estimate (IDC 2014a) for growth of the ?digital universe? to 2020. Taking a bottom-up approach to the technology used for storage in data centres, we have been able to compare our calculated energy use with the top-down figures from the GeSI Smarter 2020 (GeSI 2012) study. The comparison suggests that the energy growth forecast by GeSI is achievable, but only if significant volumes of data is moved to offline ?cold? storage. The common assumption that all useful data will be available instantly online for all time is not sustainable nor realistically achievable.
Our figures, too, are in some ways optimistic. Not all data will be held in energy-optimised data centres. Even in 2020, it is likely (Seagate 2014a) that about 40% of data storage will be outside data centres. This storage will be a mix of old and new technologies embedded in consumer electronics, for example, and will unnecessarily consume significant amounts of energy. Further work is required to determine the best trade-off between energy use for storage (in data centres and elsewhere), for computing and for communications. It is likely that the best mix will be service-dependent.
As is described elsewhere (Lambrechts 2014), good information lifecycle management practices can mitigate the need for ever greater data storage; especially when data is purged at the end of its useful lifecycle. For the data that remains in storage, there needs to be a clear division between that which should be available online and that which could be stored in long-term, less accessible cold storage. Essentially, there has to be a realisation that online data storage comes with a significant, ongoing cost: a trade-off between energy use and immediacy of access needs to be made.
It should be noted, too, that we have considered only use-phase energy. There is, in addition, significant energy used in the manufacture, shipping and disposal of storage equipment ? the so-called embodied energy. Fortunately, the smaller footprint of future storage technologies suggests that the embodied energy per byte may decrease. A full analysis of this issue would be a significant study in itself.
Ever increasing data storage remains a key issue for future IT and communications services. Barring some unknown and unlikely breakthrough technologies, it is essential that better data management practices, clear service-dependent judgement about the need for online storage, and judicious use of energy-efficient technologies are all used to provide a sustainable future for data storage.
References
Brodkin, Jon. 2014. Why Facebook thinks Blu-ray discs are perfect for the data center ? February 1, 2014
http://arstechnica.com/information-technology/2014/01/why-facebook-thinks-blu-ray-discs-are-perfect-for-the-data-center/, retrieved August 8, 2014.
Electronista. 2013. Western Digital ships first helium-filled 6TB 3.5-inch hard drives
http://www.electronista.com/articles/13/11/04/new.drives.increase.data.density.lower.operating.temperatures/, retrieved August 8, 2014.
EMC. 2012. EMC, VNX and Energy Efficiency, EMC Whitepaper ? Marca51h 2012, available at http://www.emc.com/collateral/hardware/white-papers/h10525-vnx-energy-efficiencies-wp.pdf, retrieved August 8, 2014.
EMC. 2014. EMC Digital Universe Study, Interactive Report with research and analysis by IDC ? April 9, 2014, http://www.emc.com/leadership/digital-universe/index.htm, retrieved August 8, 2014.
Gartner. 2012. Gartner Says the Personal Cloud Will Replace the Personal Computer as the Center of Users' Digital Lives by 2014, Gartner Newsroom - Press Release March 12, 2012, http://www.gartner.com/newsroom/id/1947315, retrieved August 8, 2014.
GeSI. 2012. Smarter 2020: The Role of ICT in Driving a Sustainable Future, GeSI Report published December, 2012, http://gesi.org/SMARTer2020, retrieved August 8, 2014.
HGST. 2013. HGST Ships 6TB Ultrastar He6 Helium-filled Drives for High-density, Massive Scale-out Data Center Environments ? Press Release November 4, 2013, http://www.hgst.com/press-room/press-releases/hgst-ships-6TB-Ultrastar-HE6-helium-filled#sthash.jrL54MC3.dpuf, retrieved August 8, 2014.
IDC. 2011a. Extracting Value from Chaos, IDC paper sponsored by EMC ? June 2011, http://australia.emc.com/collateral/analyst-reports/idc-extracting-value-from-chaos-ar.pdf, retrieved August 8, 2014.
IDC. 2011b. The 2011 IDC Digital Universe Study, IDC paper sponsored by EMC ? June 2011, http://www.emc.com/collateral/about/news/idc-emc-digital-universe-2011-i....
IDC. 2014a. The Digital Universe of Opportunities: Rich Data and the Increasing Value of the Internet of Things (#IDC_1672), IDC Whitepaper sponsored by EMC ? April, 2014.
IDC. 2014b. New Possibilities for Tape Storage in the Age of Cloud and Big Data, IDC paper sponsored by Fujifilm ? February 2014 http://www.fujifilmusa.com/products/tape_data_storage/case_studies/pdf/IDC_WP_New_Possibilities_for_Tape_Storage.pdf
Komorowski, Matthew. 2014. A History of Storage Cost (update), http://www.mkomo.com/cost-per-gigabyte-update, retrieved August 8, 2014.
Koomey, J.G. 2011. Growth in data center electricity use 2005 to 2010, http://www.analyticspress.com/datacenters.html, retrieved August 8, 2014.
Lambrechts, Jan. 2014. ?Information Lifecycle Governance (ILG): Maximise data value, reduce data growth, cost and risk?. Australian Journal of Telecommunications and the Digital Economy, Vol 2 No 3.
Latamore, Bert. 2012. Five Tier Storage Model, http://wikibon.org/wiki/v/Five_Tier_Storage_Model, retrieved July 30, 2014.
Merian, Lucas. 2013. New hard drive tech will help Seagate crack 5TB barrier in 2014, 20TB in 2020, http://www.pcworld.com/article/2048586/new-hard-drive-tech-will-help-seagate-crack-5tb-barrier-in-2014-20tb-in-2020.html, retrieved July 28, 2014.
Seagate. 2014a. Seagate Storage & Application Guide, Seagate Technology Whitepaper - February 18, 2014, http://searchstorage.rl.techtarget.com.au/detail/RES/1392289185_291.html, retrieved August 8, 2014.
Seagate. 2014b. Seagate Ships World's Fastest 6TB Drive For Scale-out, Cloud-based Data Centers ? Press Release April 7, 2014, http://www.seagate.com/about/newsroom/press-releases/Seagate-ships-worlds-fastest-6TB-drive-enterprise-capacity-pr-master/, retrieved August 8, 2014.
Seagate. 2014c. Seagate 1200 SSD Data Sheet, http://www.seagate.com/www-content/product-content/ssd-fam/1200-ssd/en-us/docs/1200-ssd-ds1781-4-1310us.pdf, retrieved August 8, 2014.
Seagate. 2014d. Seagate Ships World?s First 8TB Hard Drives ? Press Release August 26, 2014, http://www.seagate.com/about/newsroom/press-releases/Seagate-ships-world..., retrieved September 8, 2014.
SGI. 2010. Enterprise MAID Quick Reference Guide ? Published 2010. http://www.sgi.com/pdfs/4213.pdf, retrieved August 8, 2014.
StorageNewsletter. 2014a. Panasonic and Sony Define Archival WORM Disc at 300GB ? March 12, 2014. http://www.storagenewsletter.com/rubriques/optical/panasonic-and-sony-define-archival-worm-disc-at-300gb/, retrieved August 8, 2014.
Storage Review. 2014. Seagate Enterprise Turbo SSHD Review, Storage Review Enterprise Lab ? February 14, 2014, http://www.storagereview.com/seagate_enterprise_turbo_sshd_review, retrieved August 8, 2014.
Uptime Institute. 2013. 2013 Data Center Industry Survey, available at http://uptimeinstitute.com/2013-survey-results (subscription required), retrieved August 10, 2014.
Van Heddeghem, W, Lambert, S, Lannoo, B, Colle, D, Pickavet, M, Demeester, P. 2014. Trends in worldwide ICT electricity consumption from 2007 to 2012, Computer Communications Journal 50 (2014) 64?76, http://www.internet-science.eu/publication/789, retrieved August 8, 2014.
Walter, Chip. 2005. ?Kryder?s Law?. Scientific American, August. http://www.scientificamerican.com/article/kryders-law/, retrieved July 28, 2014.
Zwolenski, Matt & Weatherill, Lee. 2014. ?The Digital Universe: Rich Data and the Increasing Value of the Internet of Things?, Australian Journal of Telecommunications and the Digital Universe, Vol 2 No 3.
Glossary
BAU Business as usual
CAGR Compound Annual Growth Rate
EB Exabyte (1018 bytes)
GDC Global Data Centre
HDD Hard Disk Drive
IO Input-Output
MAID Massive Array of Idle Disks
NAS Network Attached Storage
PB Petabyte (1015 bytes)
PUE Power Usage Effectiveness
RAID Redundant Array of Inexpensive Disks
RFID Radio Frequency Identification
SAS Serial Attached SCSI
SATA Serial Advanced Technology Attachment
SCSI Small Computer System Interface
SNIA Storage Networking Industry Association
SSD Solid State Drive
SSHD Solid State Hybrid Drive
TB Terabyte (1012 bytes)
VTL Virtual Tape Library
W Watt
WORO Write Once, Read Occasionally
YB Yottabyte (1024 bytes)
ZB Zettabyte (1021 bytes)