Abstract
In the future Internet of Things, many common household devices will have communications interfaces added. The gathering of data from these household IoT-enabled devices will incur an energy cost and, in this paper, we investigate the impact of different communications technologies and protocols on that cost. As a first step towards energy-efficient design, we have measured the power consumption of several popular wireless interfaces – Bluetooth (Classic and Low Energy), ZigBee, Wi-Fi and 433 MHz module (RF433). We then combine these measurements through the example of a simple domestic stock control application and we show how an energy-efficient communications paradigm can be designed in each case. In general, both the communications paradigm and the amount of traffic need to be considered for an energy-efficient design. This is a contribution to design guidelines for energy-efficient communication in the Internet of Things as it expands to encompass all consumer devices.
Introduction
The Internet of Things (IoT) (Atzori, Iera & Morabito, 2010) is not just about new sensors and actuators but will include, in the domestic realm, many consumer devices that are not currently networked and do not draw electricity when they are not in use. Bringing these devices into the IoT ecosystem will require the addition of communications interfaces, which will mostly be wireless. A naive approach to adding communications interfaces (e.g. a Wi-Fi module on each device) could lead to substantial additional energy consumption without any corresponding benefit in functionality, if an inappropriate design option is chosen. While this effect may be marginal for a single device, energy efficiency in communications design will be important for individual households and in aggregate may have considerable effect (for example, see chapter 14 of Weldon (2016)).
A variety of wireless network communications interfaces have been considered as enablers of the IoT, with a wide range of characteristics (e.g. bit rate, topology and energy consumption) (Atzori, Iera & Morabito, 2010; James, 2014). They include Bluetooth (Classic and Low-Energy), 802.15.4/ZigBee, 6LowPAN, Z-Wave, Thread, DECT-ULE, EnOcean, Wi-Fi, NFC, ANT/ANT+, WirelessHART and a number of proprietary protocols. Here, we compare the energy consumption characteristics of five common commercial off-the-shelf (COTS) wireless interfaces, which represent todayâs dominant COTS interfaces for IoT application and are expected to see significant growth in the near future (OnWorld, 2017; OnWorld, 2018). They are Bluetooth Classic (BT), Bluetooth Low Energy (BLE), ZigBee, Wi-Fi and 433 MHz module (referred to as RF433 in this study). Power consumption of the COTS interface options was measured for their various states of operation and combined to determine their energy use in different scenarios.
To examine the options for energy-efficient communication using these COTS devices, we employ a simple stock control application involving a domestic toaster communicating with a gateway hosting an inventory system. This application is rich enough to encompass the full range of communication options while being simple enough to enable a straightforward analysis of energy consumption. The application choice is in line with developing interest in âsmart kitchensâ (Pal Amutha, Sethukkarasi & Pitchiah, 2012) and automated stock control for online reordering of basic grocery items (Hsu et al., 2006; Yang et al., 2014) as part of assisted living.
While the example given here may be somewhat contrived, it illustrates the point that careful design for energy usage and efficiency in the IoT will be important. The type and volume of data, the frequency of data transmission, and the type of communications interface should all be considered.
In this paper, we first give a brief description of the five wireless network communication protocols and describe the measurements obtained through experiments. We then combine these measurements using the example IoT application to determine the energy consumption of several communications paradigms. We use these results to describe energy-efficient design options for future domestic IoT applications.
Wireless Network Protocols
There are several short-range wireless network communications protocols that are considered as part of the enabling technologies of the in-home IoT. In this section, we present a brief description of the five commonly employed wireless network protocols for IoT applications: Bluetooth Classic; Bluetooth Low Energy; Wi-Fi; ZigBee; and Radio Frequency 433 MHz (RF433).
Bluetooth Classic
Bluetooth technology, based on the IEEE 802.15.1 standard, is designed to support short-range, ad-hoc connectivity amongst devices. Traditional or Bluetooth Classic (BT) operates in the 2.4 GHz Industrial Scientific and Medical (ISM) band using adaptive Frequency Hopping Spread Spectrum (FHSS) channel access (1600 hops/sec), with 79 defined channels of 1 MHz channel width, 32 of which are used for device discovery (Ferro & Potorti, 2005). BT devices can operate either as a master or slave, with one master interconnecting up to seven active slave devices â hence a star topology. BT is capable of data rates up to 2 Mb/s. However, BT has some major disadvantages, which limit its widespread implementation in IoT applications. These disadvantages include a relatively high power consumption, large data packets with huge overhead, a complex protocol stack with large memory demand, and long connection time (Mackensen, Lai & Wendt, 2012). Additionally, while BT has some low power modes (e.g. sniff mode), it lacks an effective sleep-mode regime, which is critical for minimising energy consumption in the case of battery-operated IoT devices.
Bluetooth Low Energy
Bluetooth Low Energy (BLE) is defined in the Bluetooth Specification 4.0 (Bluetooth-SIG, 2010) as the low energy version of BT, designed for IoT-like applications â low cost and complexity, low duty cycle and infrequent transmission. Like BT, BLE (or Bluetooth Smart) is also based on the 2.4 GHz ISM band and uses FHSS but with 40 channels (including 3 advertisement channels for device discovery) of 2 MHz channel width, and a data rate of 1 Mb/s. BLE can either operate as a central (master) or peripheral (slave) device, with a slave able to connect to only one master device at a time (i.e. star topology). An important feature of BLE is its sleep-mode capability, which, in combination with a low duty-cycle application, significantly reduces the device energy consumption. A slave may broadcast a limited amount of data in an advertisement packet or, alternatively, a communications link between a master device and a slave device may be established for dedicated or higher volume traffic applications. The latest version of BLE is defined in Bluetooth Specification 5.1 (Bluetooth-SIG, 2019).
Wi-Fi
Based on the IEEE 802.11 series of standards for wireless local area network (WLAN), Wi-Fi operates on multiple frequency bands (e.g. 2.4 GHz, 5 GHz, 60 GHz) and is a widely used short-range wireless protocol. The Wi-Fi protocol has undergone several revisions (802.11a/b/g/n/ac) with 802.11ac capable of achieving broadband speeds in excess of 500 Mb/s (Perahia & Stacey, 2013). Wi-Fi supports two operating topologies: Peer-to-Peer (Ad-hoc) network topology and Star (Infrastructure) network topology. While Wi-Fi was originally designed for high-speed, short-range (up to 100 m) communication, its ubiquity in homes and places of work has resulted in an increasing use in a number of IoT applications (e.g. Smart Light Bulbs or Smart Appliances).
ZigBee
Based on the IEEE 802.15.4 standard, which defines the PHY and MAC layers, ZigBee has an established set of specifications for low power, low data-rate and short-range applications. The ZigBee Alliance defines the Network and Application Support layers (ZigBee, 2012). ZigBee operates on the class-licensed 868 MHz, 915 MHz and 2.4 GHz bands with data rates of 20 kb/s, 40 kb/s and 250 kb/s, respectively. ZigBee defines three types of devices: (a) ZigBee Coordinator (ZC) â acts as a gateway/hub and delivers the greatest capability; (b) ZigBee Router (ZR) â acts as an intermediate router in addition to application functions; (c) ZigBee End-Device (ZED) â performs application functions and is the least capable device. ZC and ZR are classified as fully functional devices, while ZED is a reduced-function device. The ZigBee protocol was designed for low complexity and low energy usage with a sleep-mode capability. In addition to its star and cluster-tree networking capabilities, the ZigBee protocol can be configured for mesh networking, which offers long reach by means of data relay. Through its mesh networking functions, ZigBee offers a âself-healingâ capability, which is the ability to create alternate paths when one node fails or a connection is lost.
RF433
Based on the ISM 433 MHz band, RF433 can be used for wireless data transmission, including in wireless sensors and home automation systems. Its frequency range is 433.05-434.79 MHz. RF433 is not a standardised protocol like Bluetooth, ZigBee and Wi-Fi but is a widely employed, inexpensive wireless communication option for many IoT devices and applications. Based on this background and the general belief that RF433 will be a common hardware selection in future IoT applications, it is included in this study.
Related Studies
There are a number of comparative studies in the literature, many of which feature two or more wireless network communication protocols. Some of these studies have focused on the energy utilization of the wireless protocols irrespective of any specific application domain. For example, while using representative device datasheets, one study compared, among other metrics, the power consumption of four wireless protocol standards (BT, ZigBee, Wi-Fi and Ultra-Wideband) (Jin-Shyan, Yu-Wei & Chung-Chou, 2007). They showed that, while BT and ZigBee consume remarkably less power, they are far less energy-efficient than Wi-Fi and UWB (Ultra-Wide Band) for higher data rates. A more comprehensive survey of the characteristics of BT and Wi-Fi, using an experimental study of similar example chipsets programmed with the same data rate for a single connection scenario showed that Wi-Fi consumes five times more power than BT (Ferro & Potorti, 2005). Applying datasheet values in a simulation study of raw data transmission for BLE, ZigBee and Wi-Fi modules, Shahzad & Oelmann (2014) showed ZigBee being more energy efficient for low data payloads, while Wi-Fi was least energy efficient; but the reverse for high data payloads. The difference is mainly attributed to the shorter connection time of ZigBee as compared to Wi-Fi, but the larger frame size of Wi-Fi enabled more data transmission per Tx/Rx transaction for high data payloads. From the measurement-based comparisons, Mikhaylov, Plevritakis & Tervonen (2013) examined the energy consumption of BLE, ZigBee and SimpliciTI (proprietary) transceivers in different modes of operation. Siekkinen et al. (2012), on the other hand, compared only BLE and ZigBee transceivers, with their result showing the energy efficiency of BLE being 2.5 times better than that of ZigBee. Dementyev et al. (2013) compared and reported power consumption of BLE, ZigBee and ANT+ protocols in varying cyclic sleep intervals. They showed that a device sleep current draw is not always indicative of its long-term energy consumption, highlighting the importance of shorter start-up connection time.
While these studies aim to show one protocol as being more energy efficient than the other, it should be noted that energy consumption ultimately depends on the device hardware implementation and this may vary from one manufacturer to the other. With some IoT services now mainstream (e.g. Home Automation), and an increasing use of wireless protocols in such applications, there is a need for application-specific studies. IoT applications vary in requirements of bit rate, latency, packet sizes and QoS; and these must be taken into account while assessing the energy-efficiency of wireless network protocols.
Measuring Energy Consumption
We measured the power consumption (energy consumption) characteristics of each of the above communication technologies, in order to be able to compare their performance in typical applications. A description of the experiment and measurement setup is given in this section. It is assumed that, for each deployment scenario, each COTS wireless interface communicates with an always-on gateway device (i.e. master, ZC, etc.).
Measurement Setup
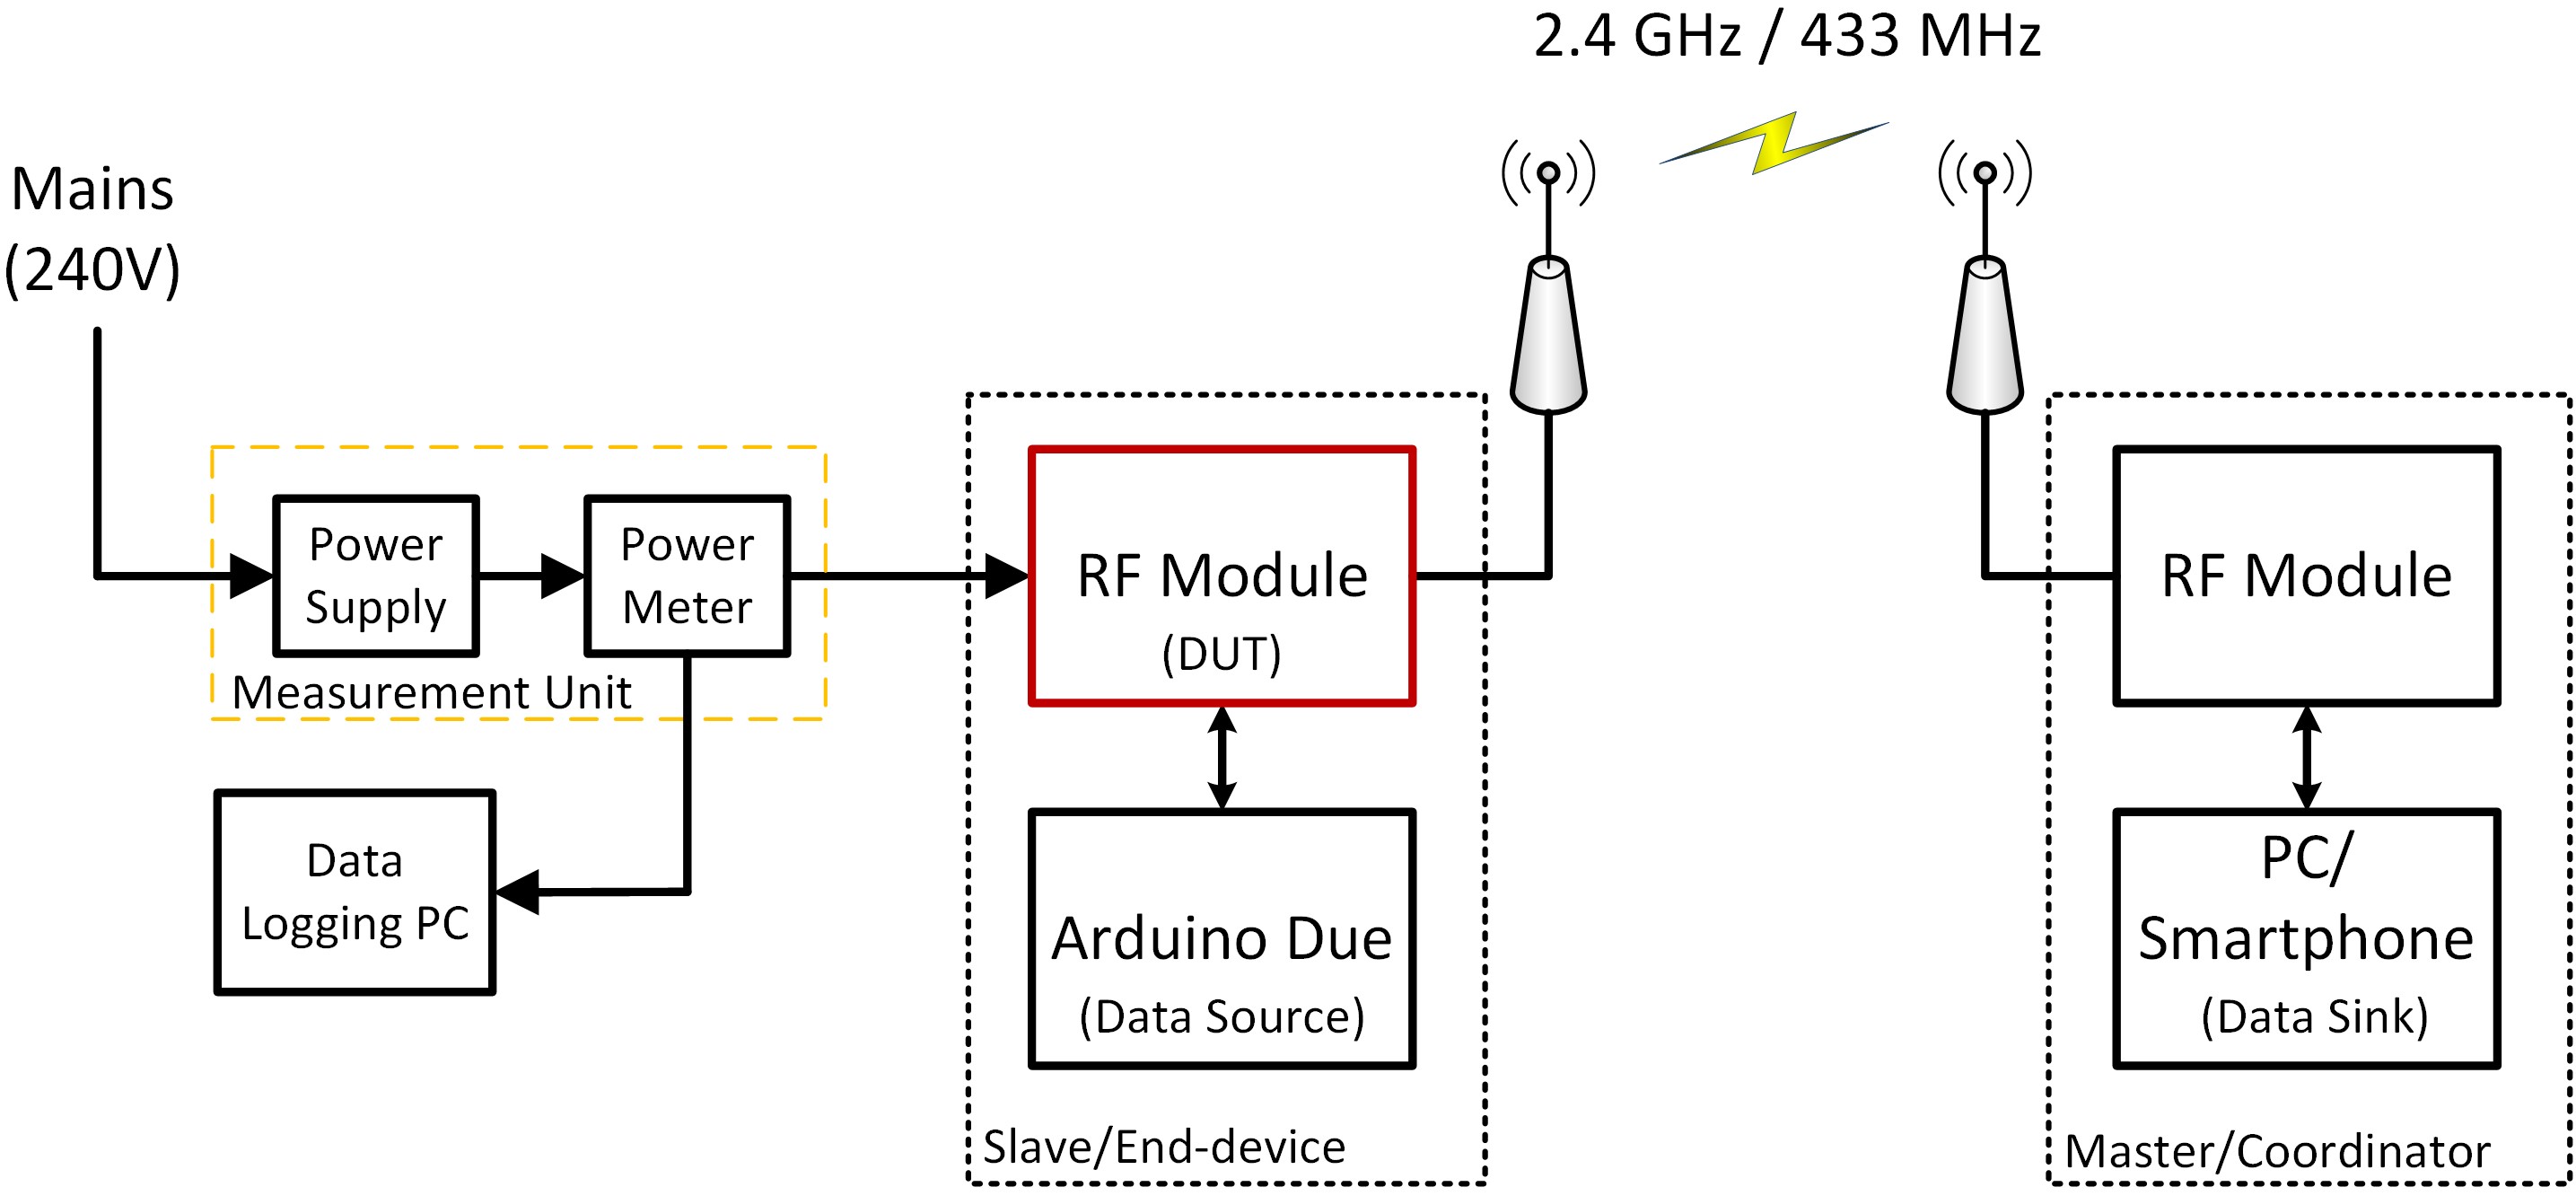
The components used in the measurements include two COTS short-range RF modules for each communication protocol, an Arduino Duemilanove (Due) board (Arduino, 2009) equipped with Atmelâs Atmega 328P-PU microcontroller (MCU), a dc power supply and power meter unit, a test computer (PC) and smartphone. The Arduino acts as a data source. A block diagram of the experiment setup is shown in Figure 1.
Figure 1. Block diagram of experiment setup.
Earlier RF modules might include separated transceiver circuitry, antenna, MCU and serial interface, but modern RF modules today are most commonly designed as a System-on-Chip (SoC) with integrated transceiver module and MCU. Hence, the RF modules in this study are measured as one SoC unit, given that in practice they may be deployed as such.
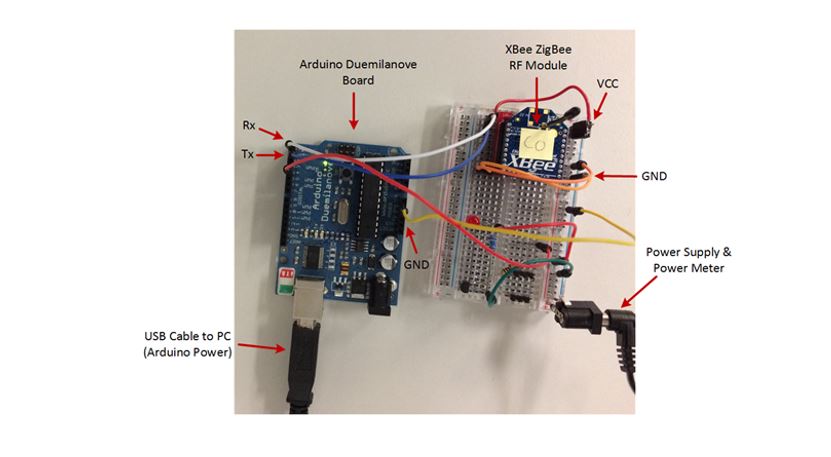
The power meter records power consumption, current draw (mA) and voltage (V) of the device under test (DUT)/end-device, and the measurements are logged on a PC for post-processing. The Arduino Due generates a pre-set 10-byte (10 B) test payload and is independently powered (not measured). Measurements are recorded at an average of 1 ms intervals with an accuracy of 10 µA and 5 mV voltage. With the exception of the RF433 modules, which are either transmit-only or receive-only, each RF module has 4 leads connected: +ve power input (VCC), Ground (GND), transmit (Tx) and receive (Rx). Figure 2 displays an image showing this setup with an XBee ZigBee RF module as an example. A similar measurement format was used for modules with a USB connection; the power line within the USB cable was interrupted and voltage and current measured, while the data lines were passed through uninterrupted. For accurate measurements of the DUT power consumption, the VCC and GND leads are directly connected to the dc power supply via a power meter, while the Tx and Rx leads are either connected to the transmit and receive ports on the Arduino board or a USB port. A steady voltage of 5V (or 3.3V where applicable) is supplied to the modules during the tests.
The master/coordinator (gateway device) modules are powered either from the power rails on an Arduino board, a USB interface of a PC or the smartphone battery but these are not measured. Packets received from the DUT are recorded with timestamps. Measurements are collected over 5 minutes. In one case, a digital oscilloscope (e.g. Digilent Analog Discovery USB Oscilloscope) in a setup with a 10 ⦠current metering shunt resistor was used for the measurement.
Figure 2. Measurement setup for an XBee ZigBee module.
In the experiment, the data source for the DUT is programmed to send the pre-set 10 B data payload every 5 seconds while the master/coordinator receives the transmitted data, which is displayed on a serial monitor using a terminal emulator such as Tera Term or Bluetooth Smart Data app.
RF Module Power Measurement Setup
Table 1 gives details of the RF modules used in the experiments. For BT measurements, a JY-MCU HC-06 module, compliant with Bluetooth v2.1 standard, was used. The serial interface of the BT DUT (slave) was configured at 9600 Baud. Bluetooth v2.0 standard lacks the very low power sleep-mode; therefore, it is assumed that the module, when not operated continuously, is turned off after every Tx and Rx operation of the DUT.
Table 1. RF modules used in experiments.
|
Standard |
Device Name |
RF Module Manufacturer |
RF Module Number |
Firmware Version |
Operating Voltage (V) |
|
Bluetooth |
JY-MCU |
Linvor |
HC-06 |
1.8 |
5 |
|
Bluetooth LE |
BLE Nano v2 |
Nordic |
nRF52832 |
- |
3.3 |
|
ZigBee |
XBee |
Digi |
XBee S2 |
28A7 |
3.3 |
|
Wi-Fi |
ESP-12F |
Ai-thinker |
ESP8266EX |
- |
3.3 |
|
RF433 |
N/A |
Exportise |
FS1000A/ZRW-01 (transmitter/receiver) |
- |
5 |
For the measurement of BLE, the Redbear BLE Nano v2 (Redbear, 2018) was used. The BLE Nano is a breakout board that simplifies prototyping or small-scale production of new IoT products, based on the Nordic nRF52832, which is a SoC including the RF module and an ARM Cortex-M4F processor at its core. The BLE Nano comes with Bluetooth v4.2 protocol stack (although Bluetooth 5 ready) and can be configured as a central or peripheral device. As the DUT, the BLE Nano was configured as a peripheral device (see Figure 1).
For ZigBee measurements, the Digi Internationalâs XBee Series 2 radio modules (Digi, 2011) were used. Using Digiâs XCTU software, one of the modules was configured as an end-device and the other as a coordinator, both with their respective firmware. Transparent mode communication was set in both XBees (AT mode) for an asynchronous serial interface of 9600 Baud. Since ZigBee modules have sleep-mode capabilities, the end-device RF module was configured in cyclic sleep mode, waking up at regular intervals to transmit its data payload before returning to sleep. The power consumption and duration for the different stages were recorded.
The ESP-12F Wi-Fi SoC module was used as a representative Wi-Fi RF module. The ESP-12F is based on the ESP8266EX chipset and is IEEE 802.11b/g/n compliant. To avoid significant variation in power due to dynamic transmit power control, the Wi-Fi module (end-device) and Access Point (AP), i.e. master, were configured in Infrastructure mode while maintaining a separation distance between 0.5 and 1 metre.
For the measurement of an RF433 module, the FS1000A transmitter and ZRW-01 receiver radio modules were used. They both use ASK modulation or On-off keying and permit bit rates up to 9.6 kb/s. Since the transmitter and receiver are independent modules, two sets of experimental configuration were needed â one for the transmitter and the other for the receiver. Our examination of a range of commercial wireless sensor devices that use RF433 radio modules showed that they are mostly transmit-only devices, designed to re-send each packet multiple times to compensate for the lack of acknowledgement (ACK) packets from the receivers. This redundancy mechanism is implemented in our application case-study described below, assuming each message is sent three times.
Power Consumption Measurement
This section describes the measurements, power consumption plots and values for examples of each type of wireless technology considered in the experiments. In addition to the main communication task (i.e. Tx and Rx), we monitor and report on other housekeeping functions (e.g., listening, wake-up, sleep) with each technology and their associated energy consumption. Power consumption values generally depend on the device hardware implementation, and may vary slightly between examples of each module type.
Table 2 lists the power draw of the RF modules during their main operational phases, while Table 3 lists their respective duration (in milliseconds) for transmitting a 10-Byte packet. Some of the values reported in this paper were previously published in Gray & Campbell (2016). For simplicity, the duration of the wake-up, pre-processing and synchronization phases was concatenated into one, i.e. wake-up, as given in Table 3. A small amount of energy is incurred to turn off or shut down the modules but these are insignificant in comparison with the other phases.
Table 2. Power consumption of RF modules in different operational phases.
|
RF Module |
Power Consumption (mW) |
||||
|
Sleep |
Listening/ Standby |
Wake-up |
Transmit (Tx) |
Receive (Rx) |
|
|
Bluetooth |
- |
16 |
96 |
199 |
185 |
|
Bluetooth LE |
0.03 |
2.2 |
21 |
41 |
33 |
|
ZigBee |
0.17 |
30 |
91 |
139 |
129 |
|
Wi-Fi |
0.03 |
62 |
412 |
227 |
227 |
|
RF433 |
- |
29 |
12 |
45 |
33 |
Table 3. Duration of operation in different operational phases.
|
RF Module |
Phase Duration (ms) |
||
|
Wake-up |
Transmit (Tx) |
Receive (Rx) |
|
|
Bluetooth |
1836 |
1 |
1 |
|
Bluetooth LE |
4 |
1 |
1 |
|
ZigBee |
5 |
2.5 |
3.5 |
|
Wi-Fi |
5.5 |
50 |
50 |
|
RF433 |
1 |
126 |
406 |
While the individual power consumption values are discussed in the following section, an observation of Table 2 reveals not so subtle differences between the DUT modules. For the Tx/Rx power, we see magnitudes between 3 and 6 times the lowest recorded value (i.e. BLE), while a more significant difference (28 times) can be seen in the standby power consumption. The latter is important in this study as some applications require modules to remain in the standby state, which could result in much higher disparity in total energy consumption. We acknowledge that the above comparisons are for different wireless technologies and also that the same technology from different manufacturers may show different results. For similar modules like BT and BLE, however, we recorded a notable difference ( 5 times) indicating some energy efficiency improvement trend, while improving communication range and other metrics.
BT Measurements
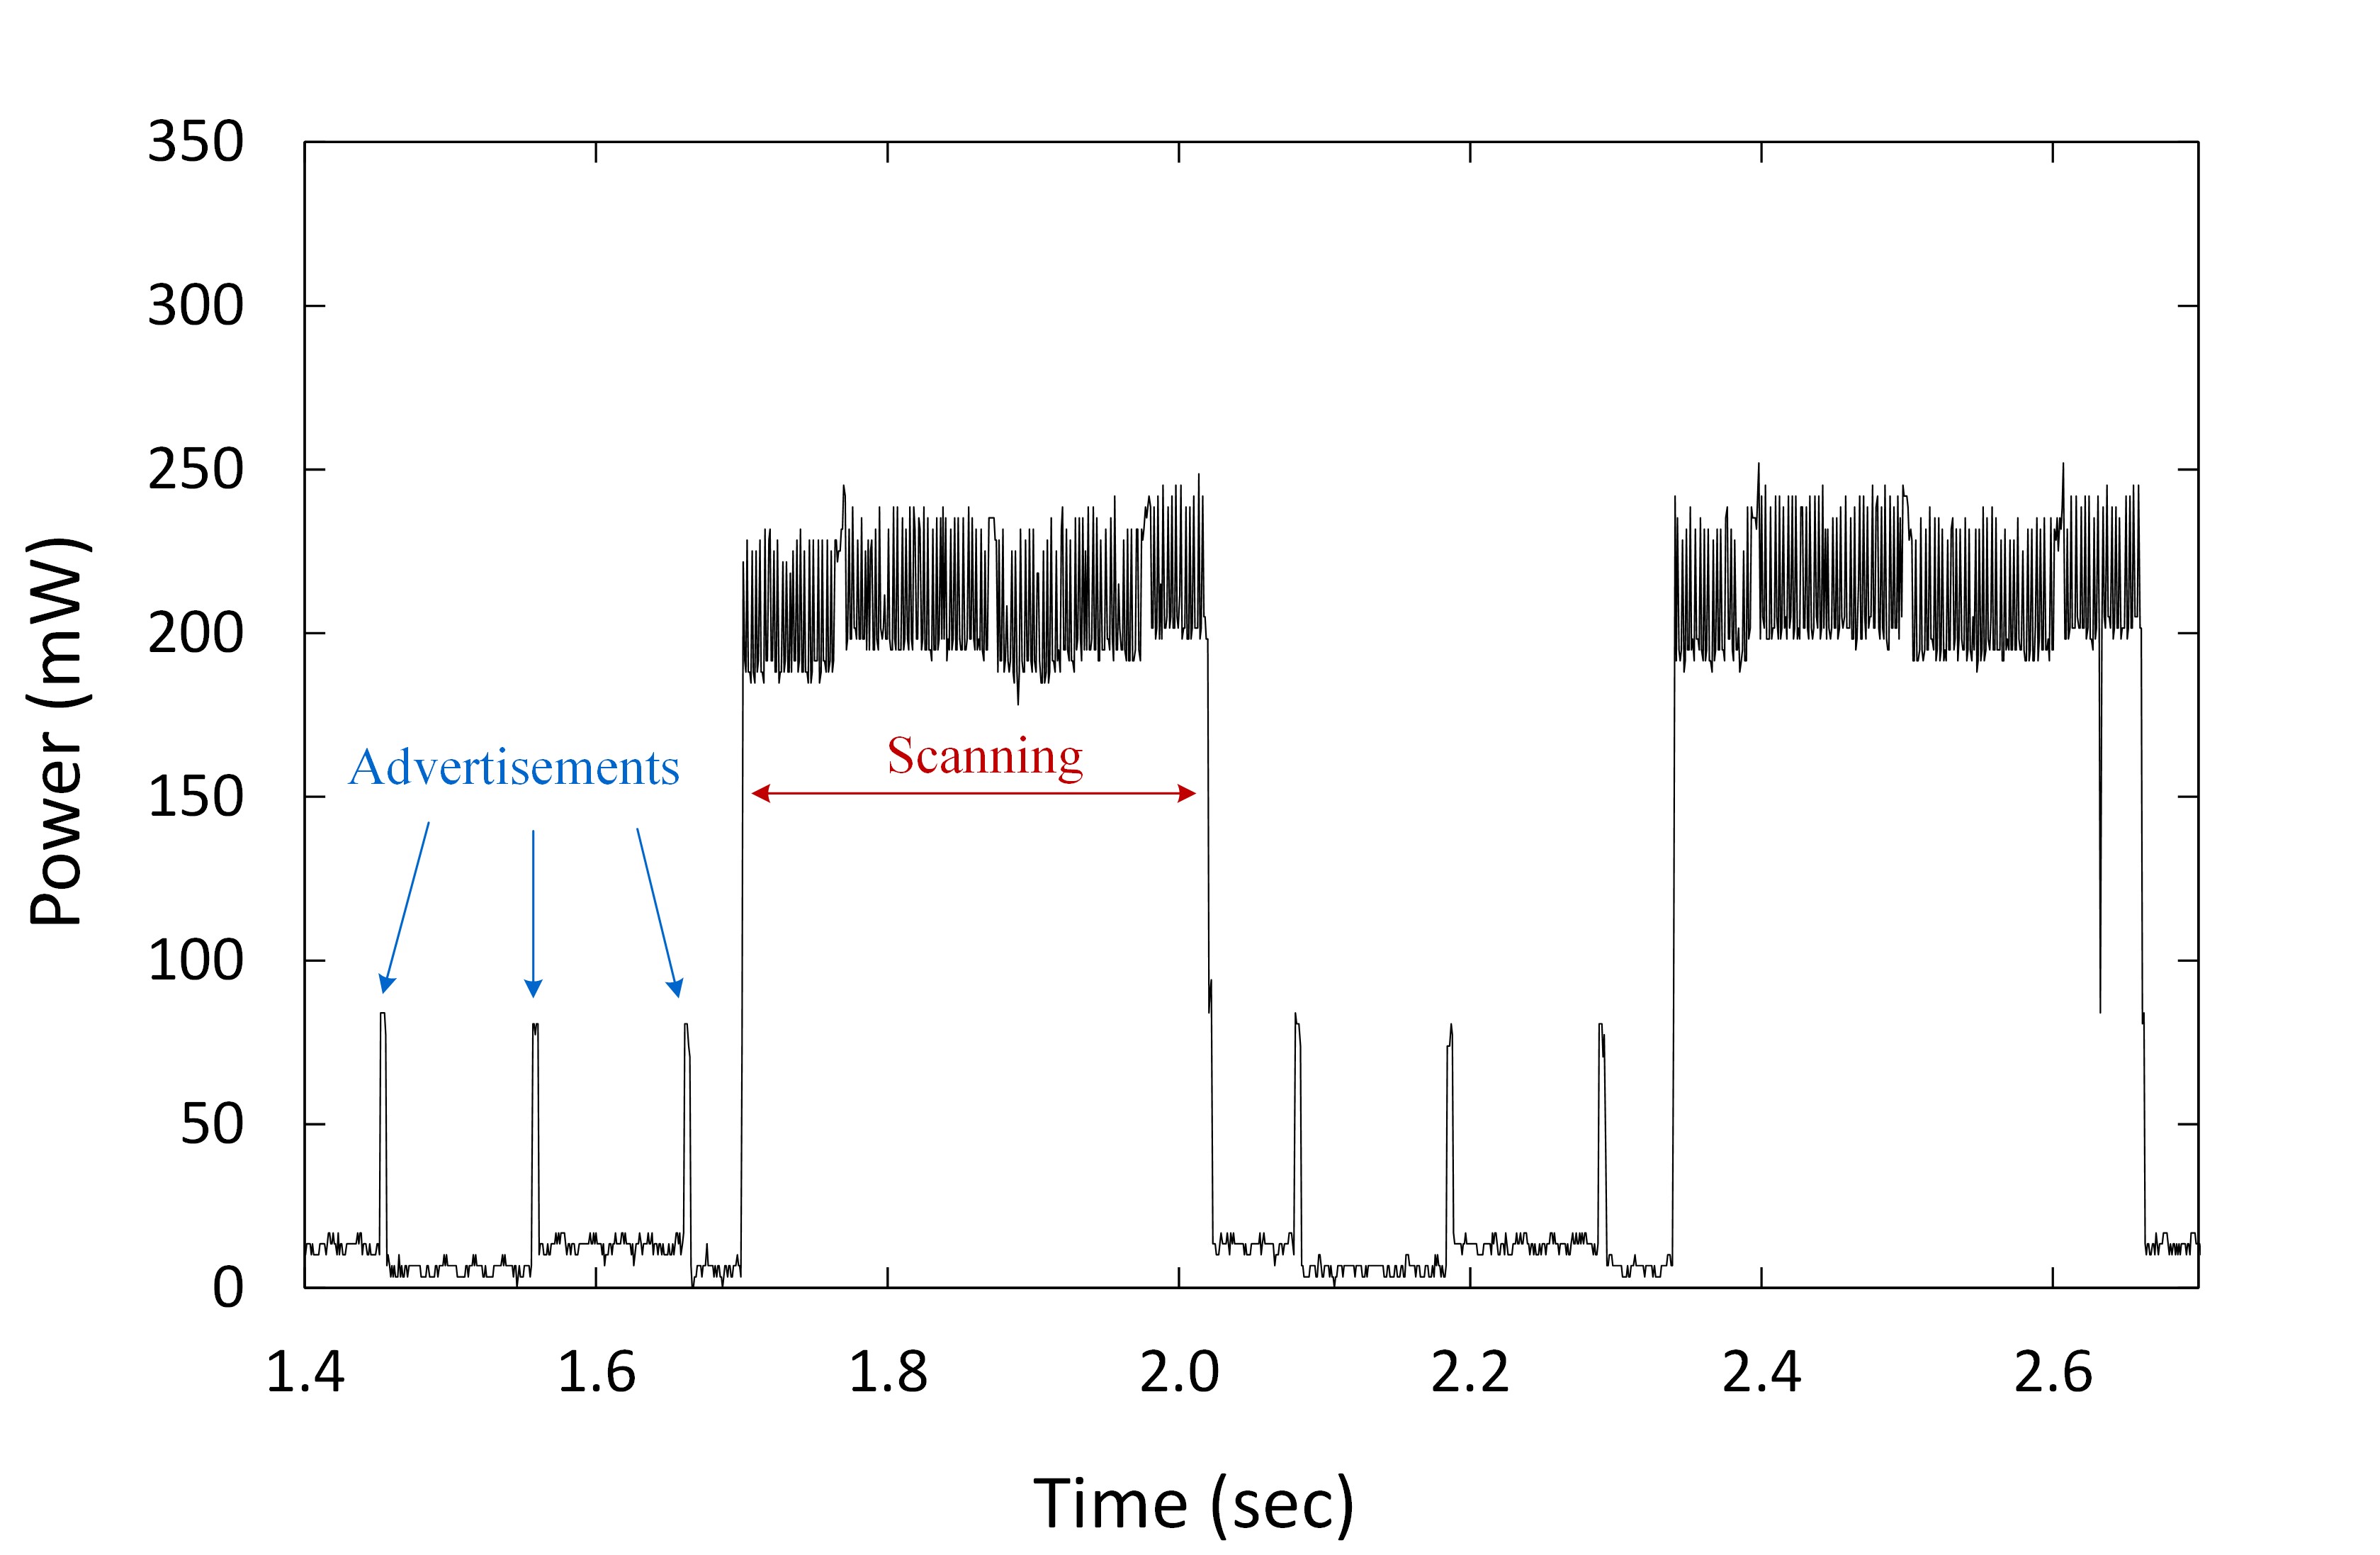
A Bluetooth link controller has a number of connection states including standby, inquiry (scan/advertise), paging, connected/active, sniff, park and hold states (Ferro & Potorti, 2005). Figure 3(a) shows the power consumption of the BT module in a non-connected standby state depicting the advertisement and scanning phases. The device sends advertisements on different channels, each round lasting about 5 ms. During advertisement, the BT module draws an average of 79 mW, consuming about 0.4 mJ each round. During scanning with nearly 100% duty cycle (duration â 320 ms), the module draws about 208 mW consuming 67 mJ, which is over 50 times more than its advertisement phase. Such a huge disparity in energy usage explains the reasoning for slave/end-devices (which are often energy constrained) being limited to sending advertisements, while master devices (often with more resources, e.g. PC/Smartphone) engage in scanning during the discovery process.
|
(a) |
(b) |
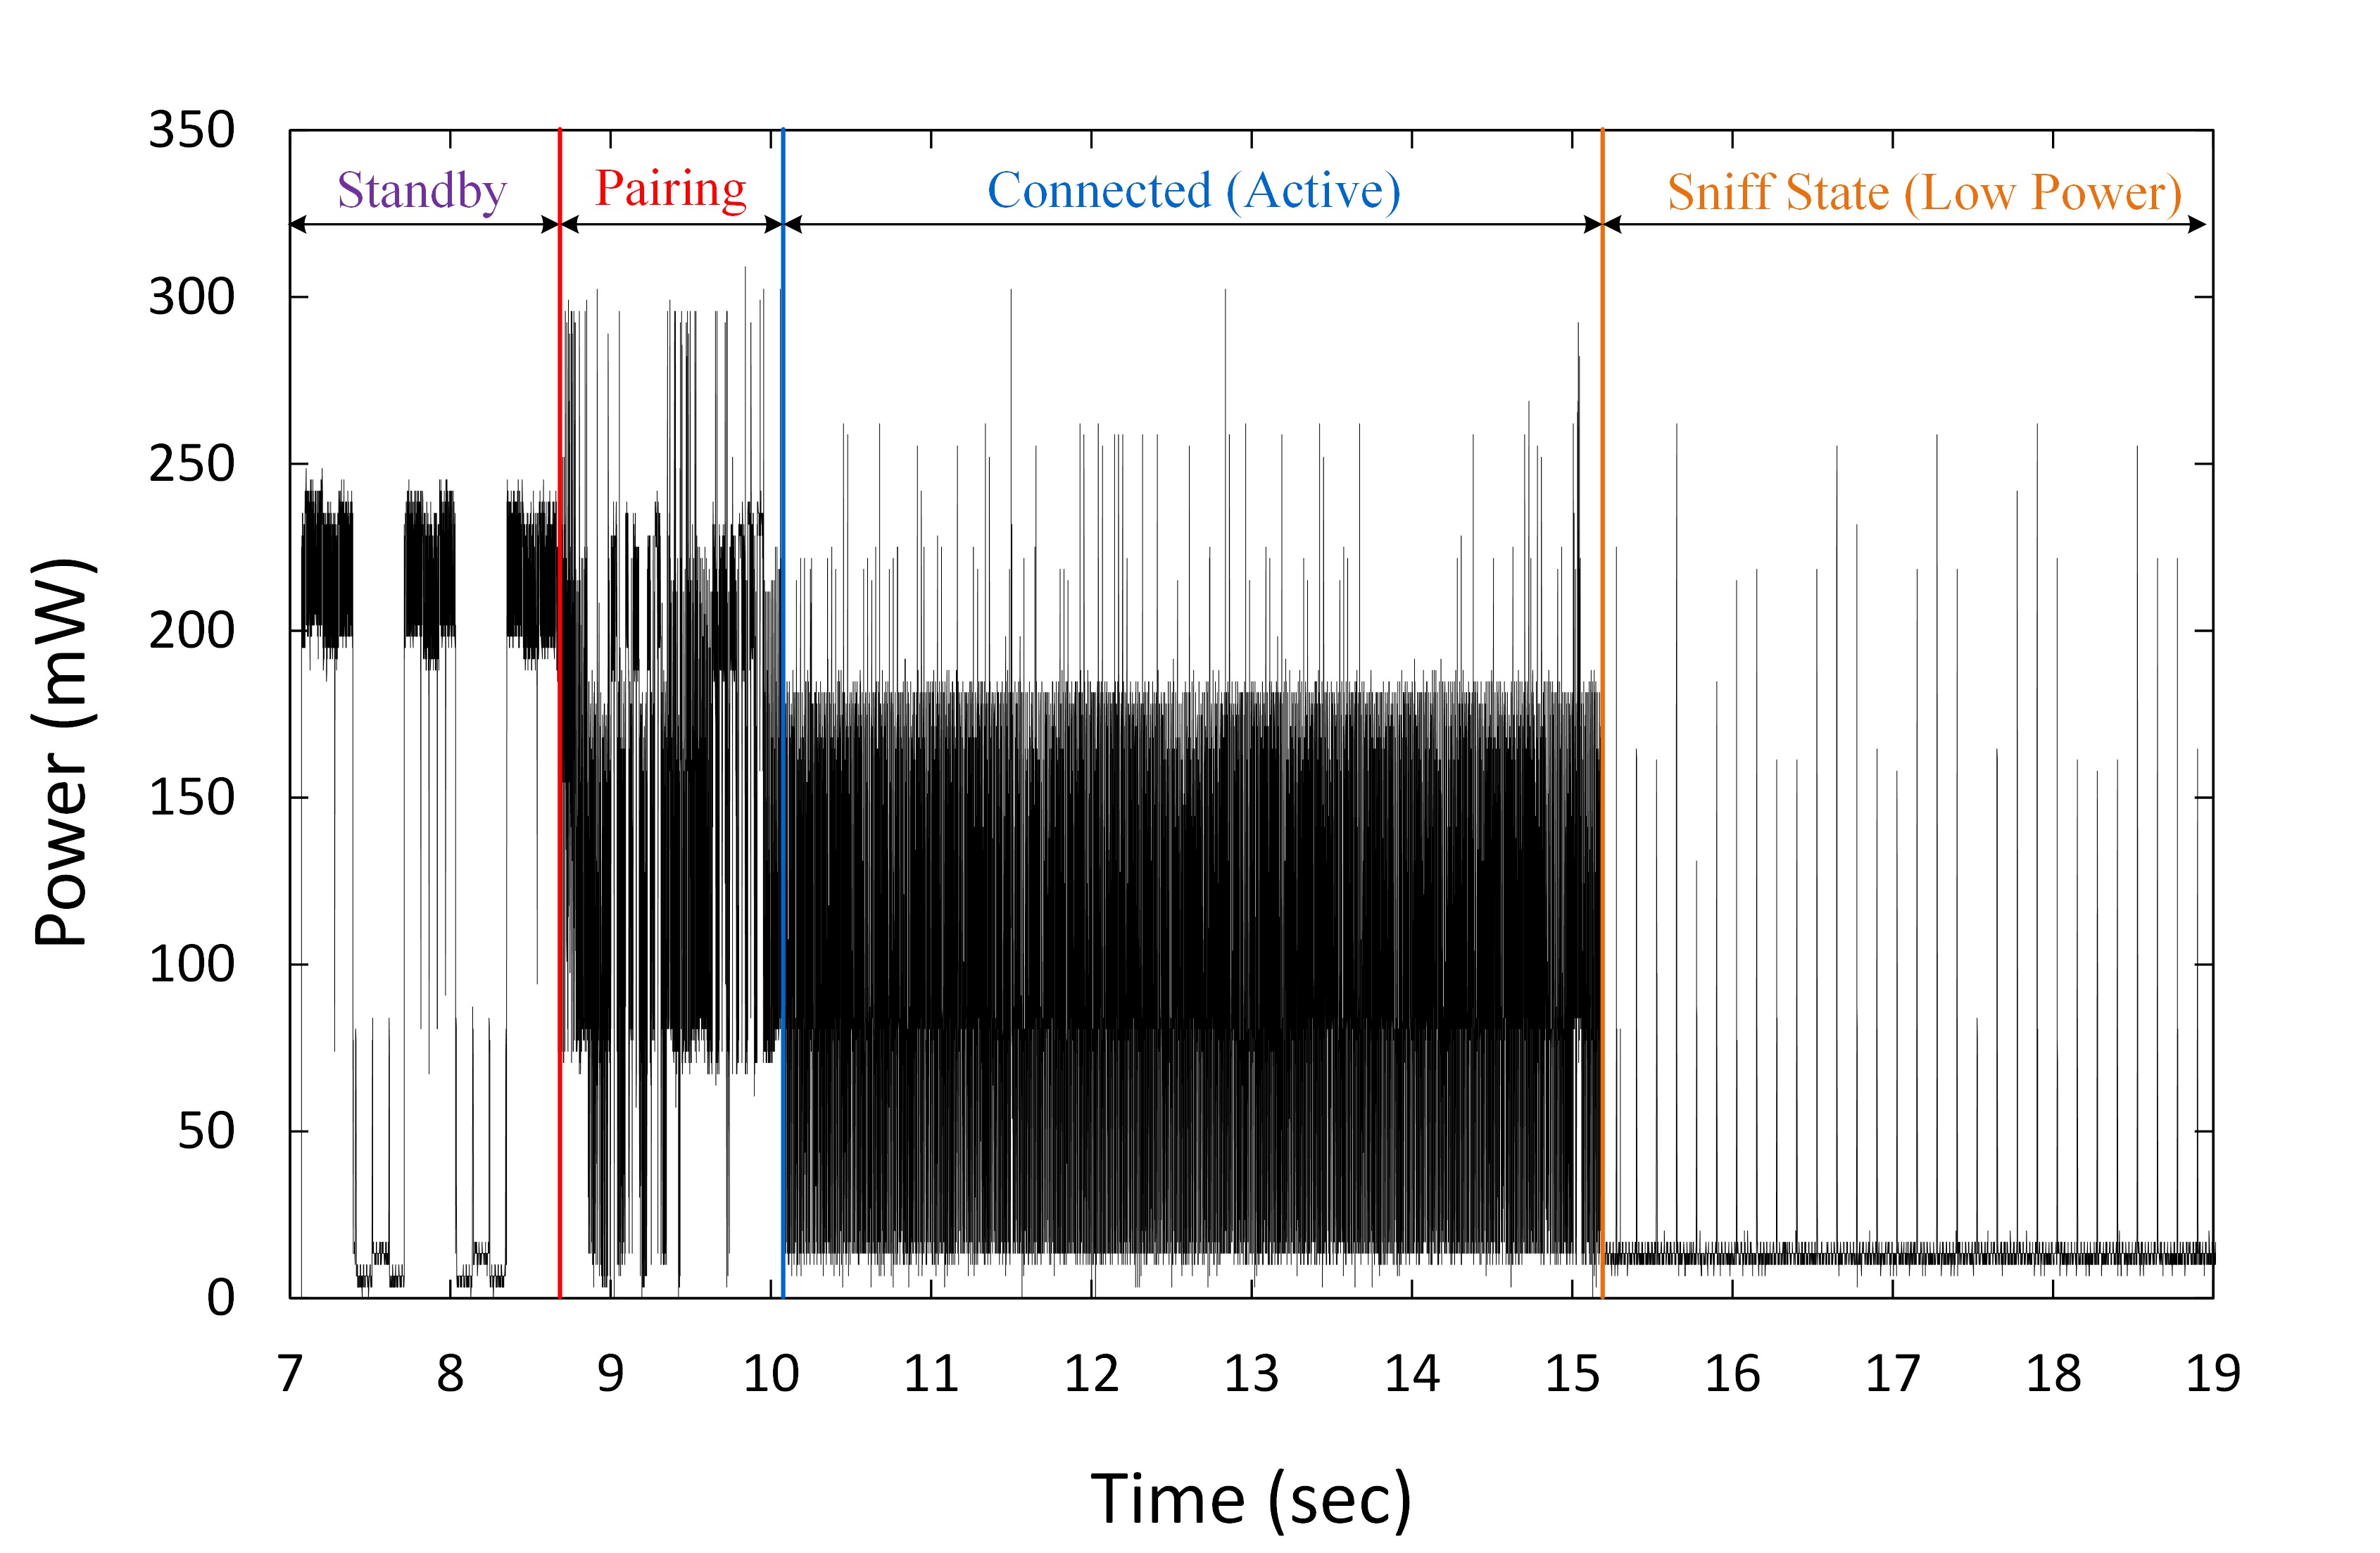
Figure 3. Power trace of BT module: (a) in standby state showing the scanning and advertising phases; (b) showing the state transitions from standby to pairing, connected and sniff states.
Figure 3(b) gives a much wider view of the major stages a BT device undergoes. The figure shows the standby state, when scanning and advertisements are performed; the pairing stage, when the paging and synchronisation process occurs; the connected stage, which includes data Tx, Rx and ACK; and lastly the low-power sniff state (i.e. listening), when the module is less-active but listens for transmissions at set intervals (125 ms in this case), depicted by the spikes on the right-hand-side of the figure. The average power consumption in the low-power sniff mode is about 16 mW. For BT, a complete data frame is transmitted per timeslot (1 timeslot = duration in 1 frequency state) in 0.625 ms, with an ACK packet received in a subsequent timeslot. Since the power meter can only resolve variations down to 1 ms, we assume a lowest duration to be 1 ms.
BLE Measurement
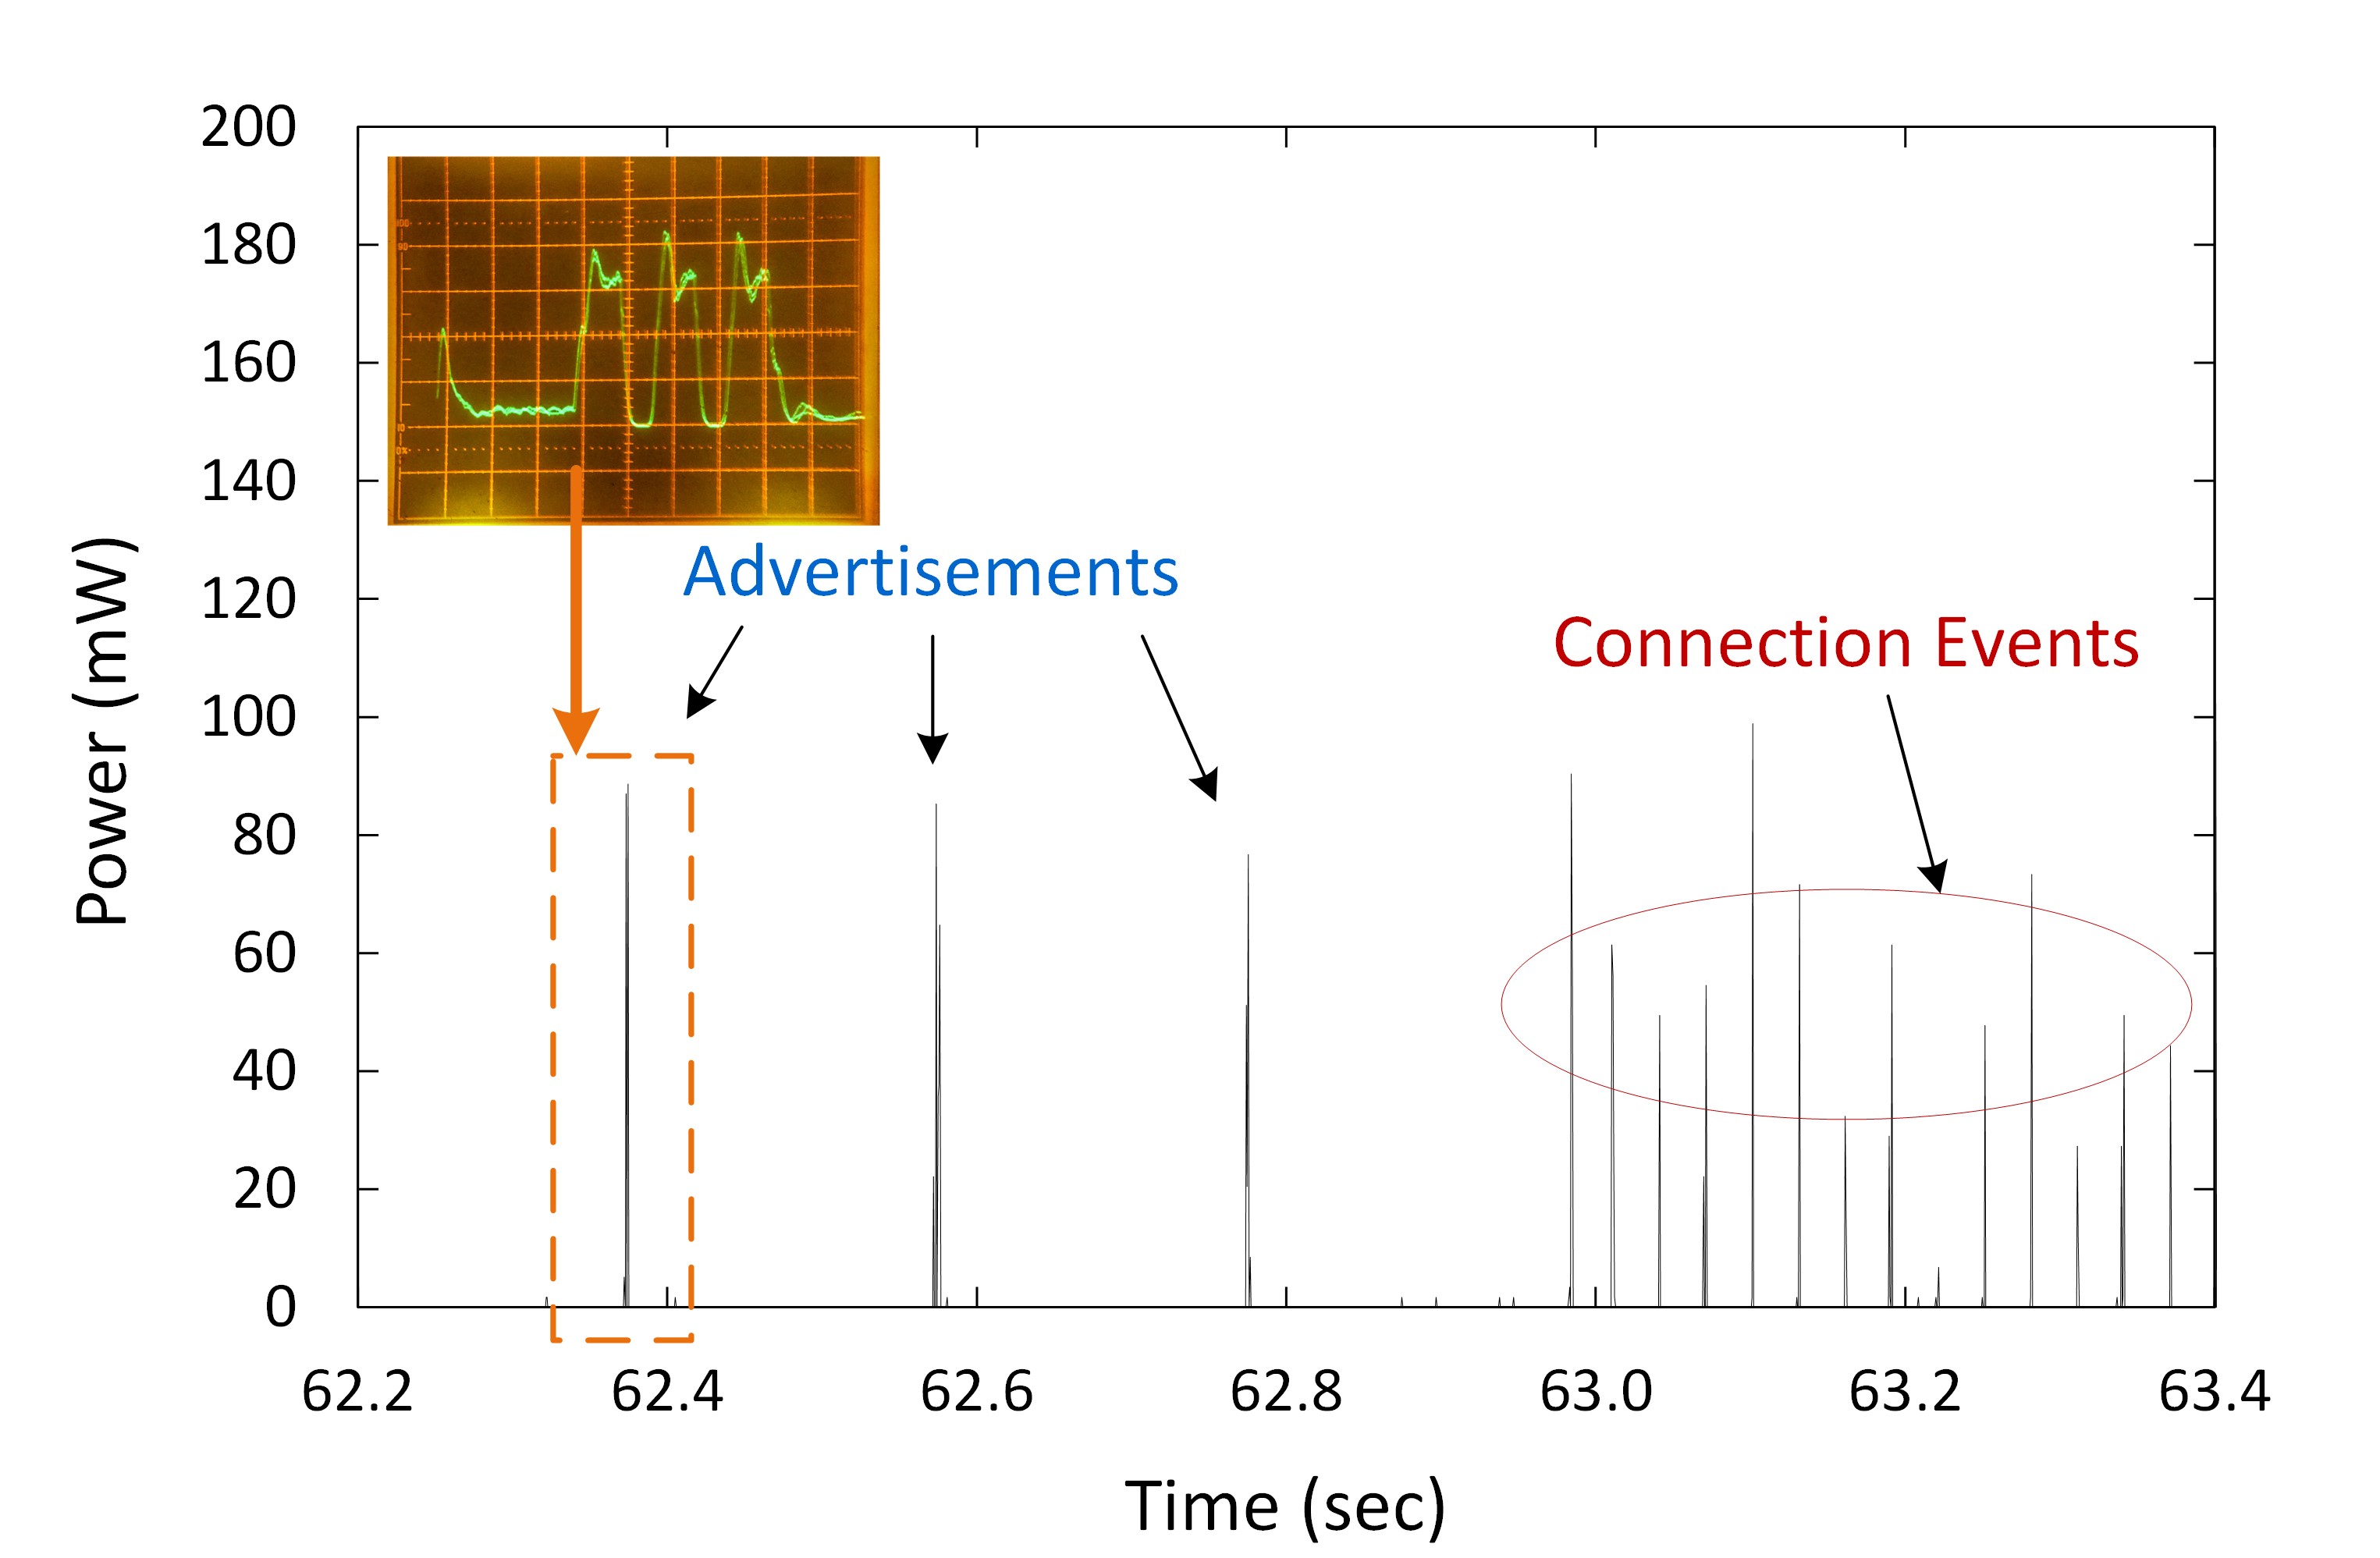
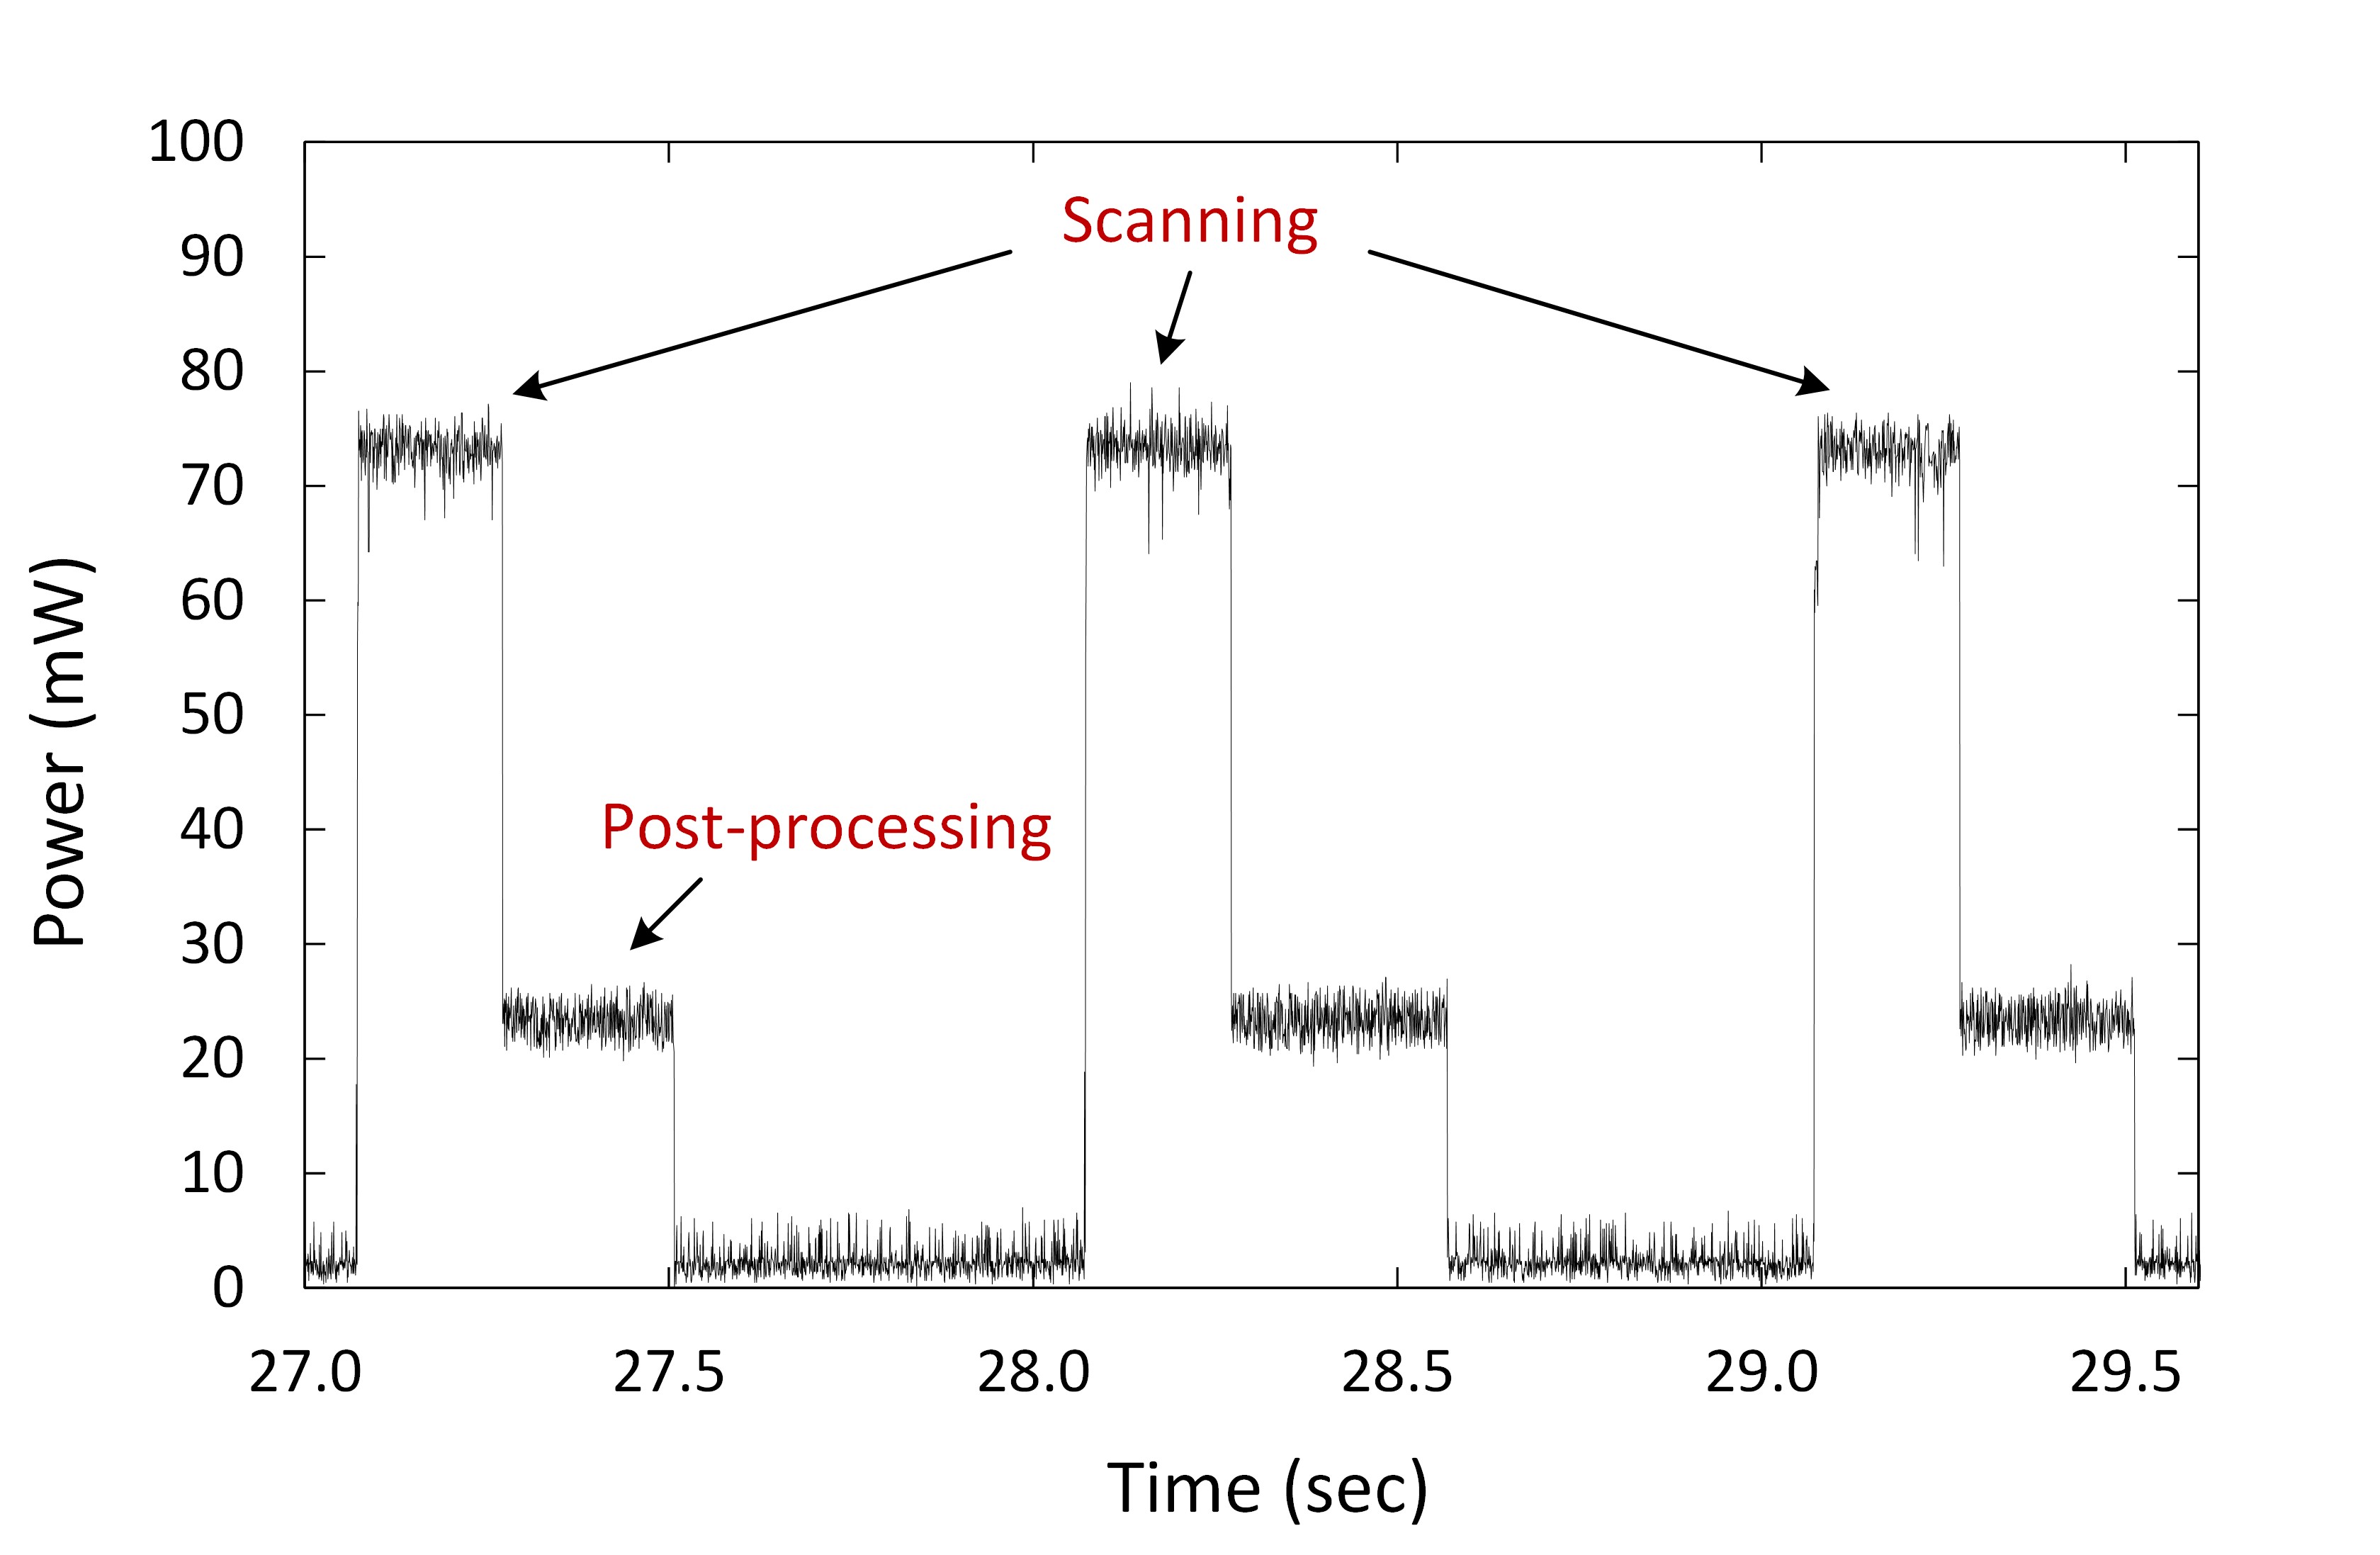
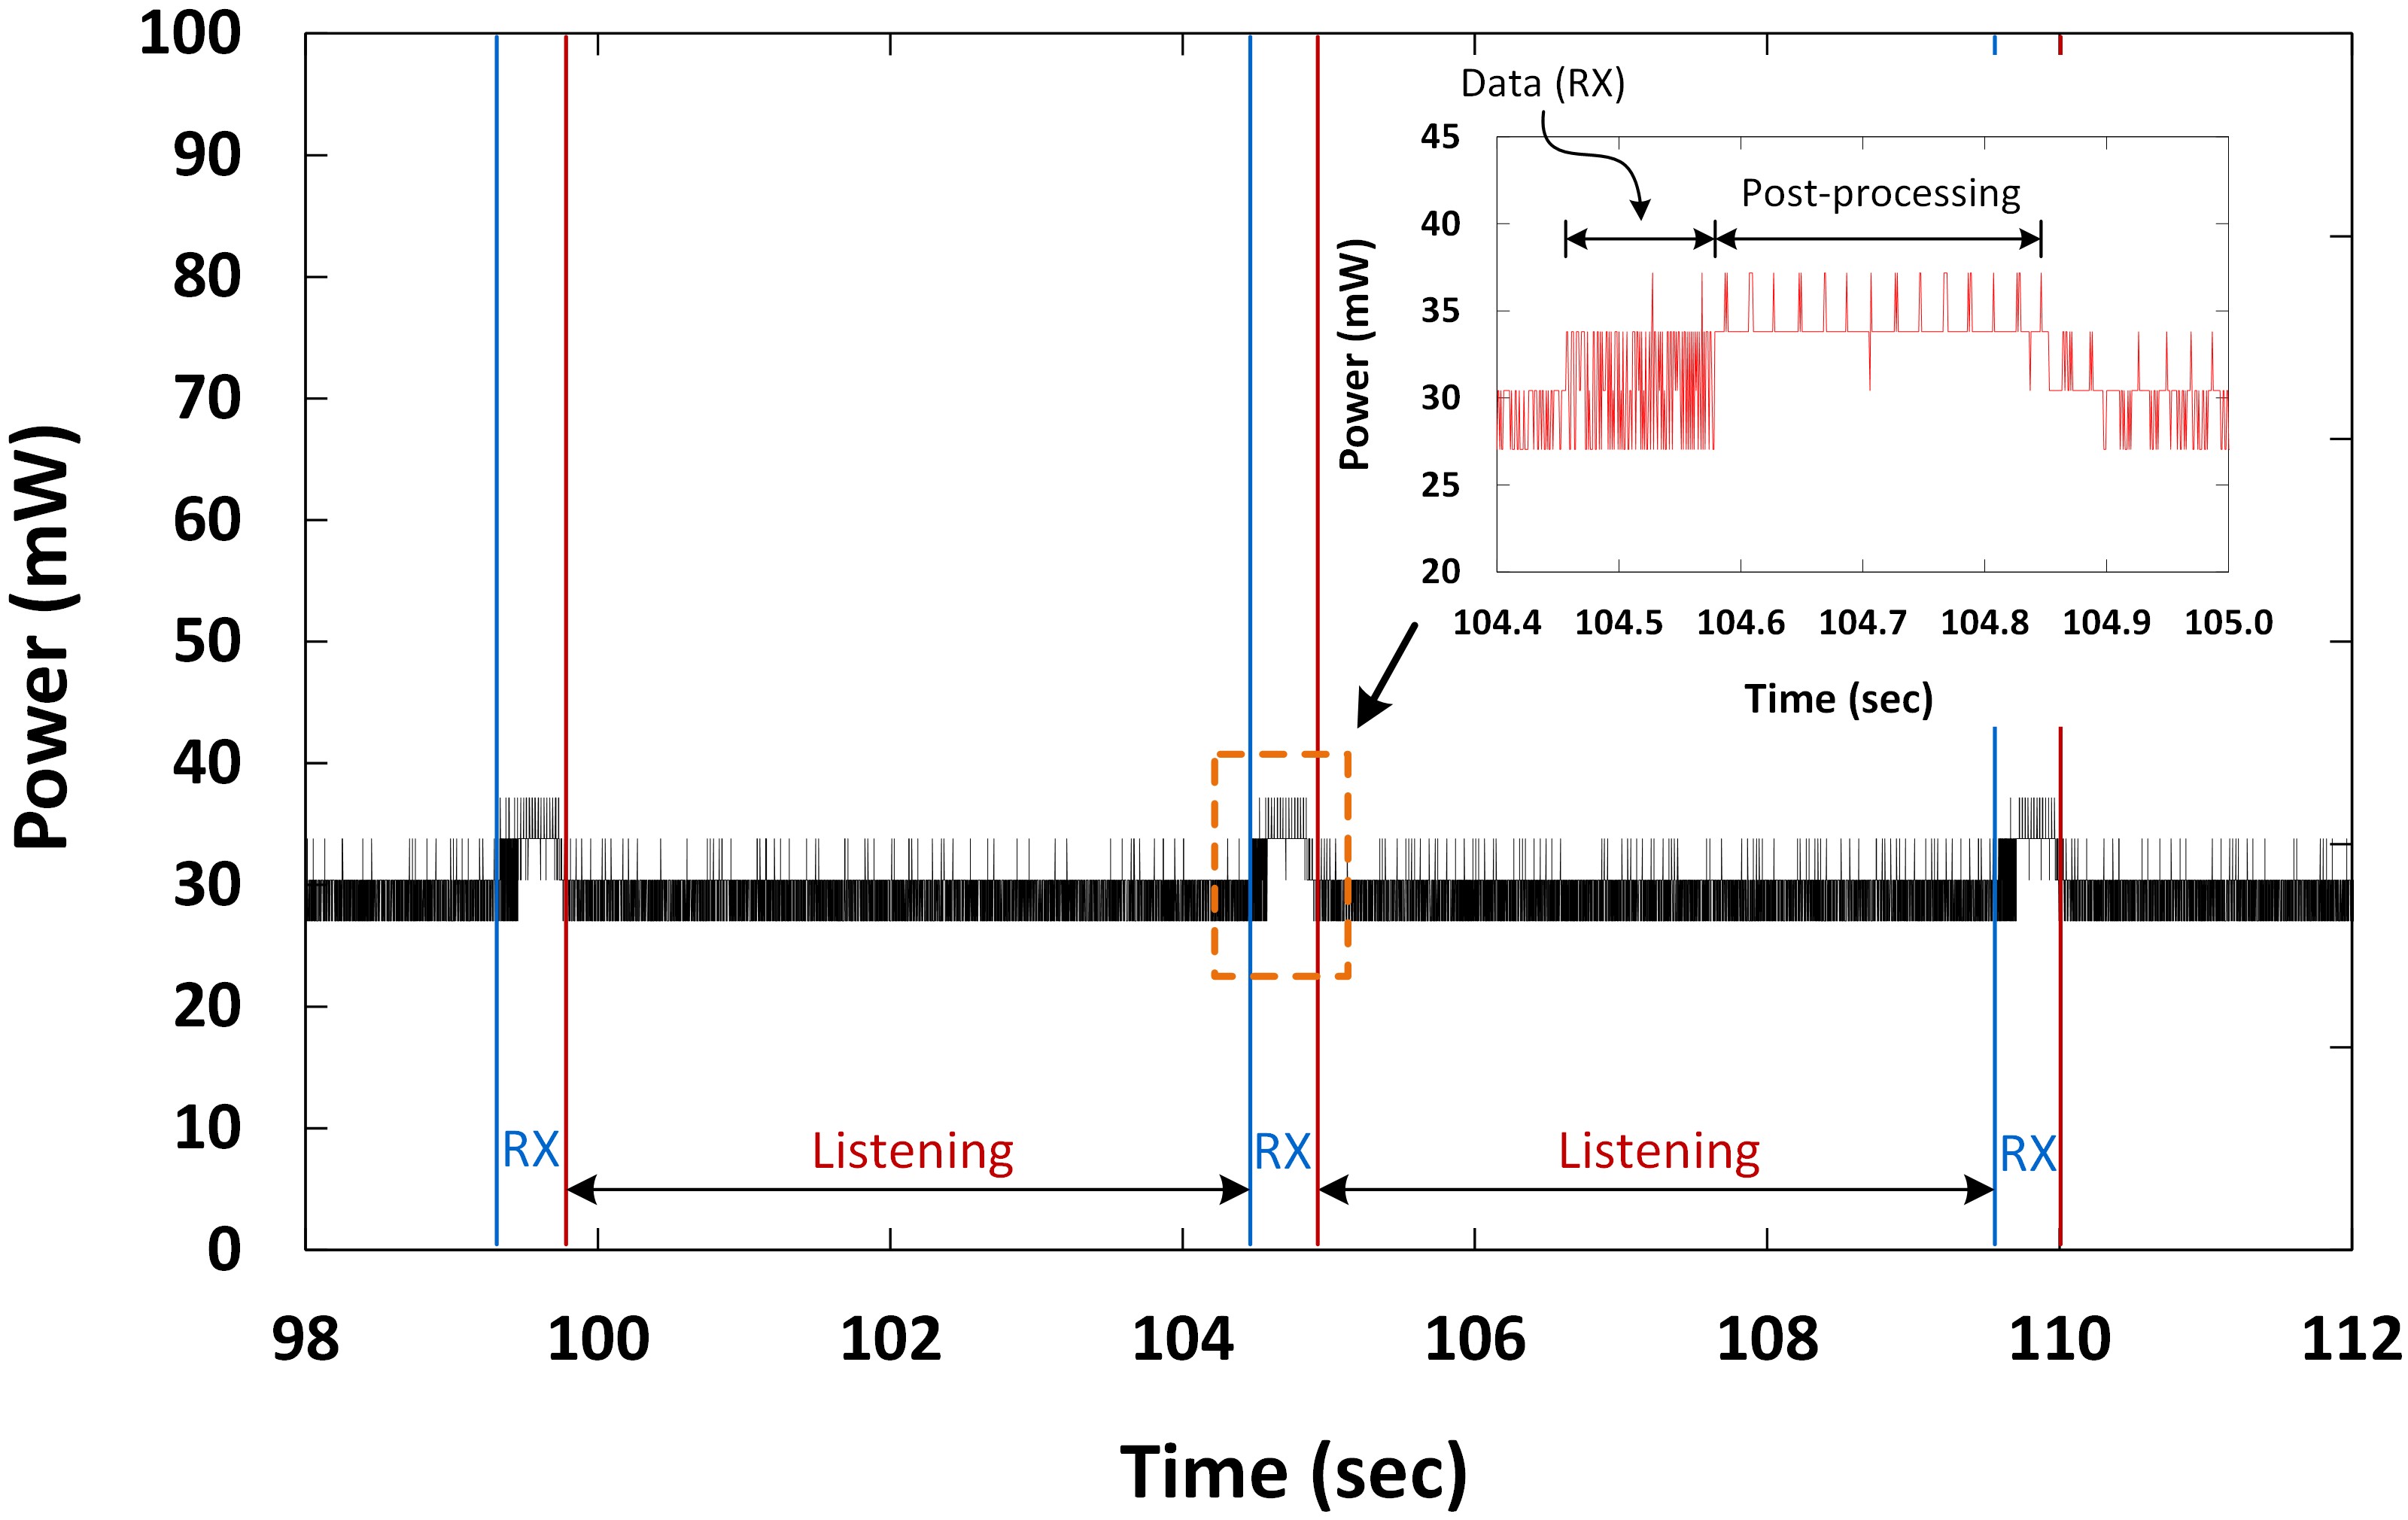
The measurement was conducted for the BLE non-connected and connected/active states. Figure 4(a) shows the power consumption trace of a BLE peripheral device advertising at 200 ms intervals, and in connected mode, with connection events depicted on the right-hand-side. Each advertisement payload was 30 B long and was transmitted to three advertisement channels. For one advertisement round, the peripheral device consumed about 0.08 mJ, lasting about 2 ms (0.625 ms per timeslot). Figure 4(b) shows the power consumption trace of a non-connected BLE central device scanning three advertisement channels with a 20% duty cycle (i.e. scan window = 200 ms, scan interval = 1s). The steps in Figure 4(b) can be attributed to its post-processing activities, drawing 23 mW. For scanning, the central device consumes 14.4 mJ per cycle.
|
(a) |
(b) |
Figure 4. Power consumption trace of BLE module configured as (a) peripheral (slave) device showing advertisements and connection events; (b) central (master) device in scanning mode.
The energy consumption of a BLE module in its non-connected states ultimately depends on the choice of a number of parameters (e.g. connection interval), which would be selected based on an application usage scenario. The measured power draw and duration of BLE connected phases are given in Table 2 and Table 3.
ZigBee Measurement
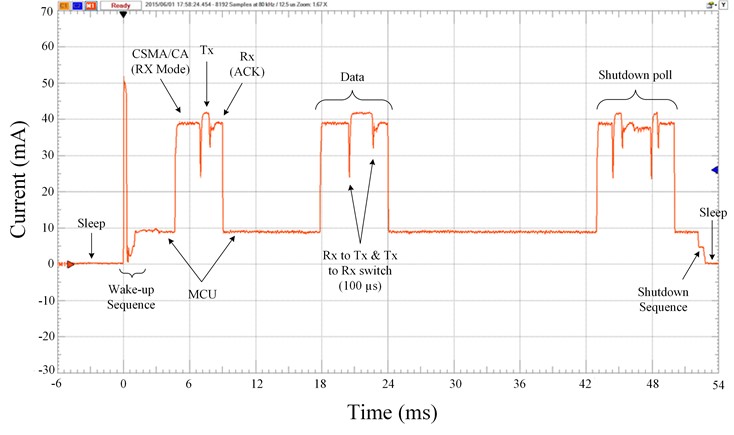
With ZigBee, the measurement was carried out on a configured XBee ZigBee end-device as the DUT, which connects to an XBee ZigBee coordinator (i.e. gateway). The DUT was configured for cyclic sleep mode with reverse polling. In reverse polling, the end-device (in sleep mode) wakes up at regular intervals (default = 100 ms but can be modified in firmware) and polls its coordinator to request any data sent to its address while sleeping. The end-device sends a poll once after its wake-up sequence and again before going to sleep. In sleep-mode, the XBee draws a maximum of 50 µA at 3.3V (Digi, 2011).
Figure 5. Current draw of the XBee ZigBee end-device module during a connection event.
Figure 5 shows a detailed plot of a ZigBee end-device module current draw for one connection event. The plot shows the wake-up sequence, which includes MCU wake-up, pre-processing and synchronisation. The initial poll is shown in the next phase, starting with the channel access process, which is the contention-based CSMA/CA as defined by the 802.15.4 MAC specification. The duration of the CSMA/CA process may vary depending on channel availability. The power consumption and duration values are reported in Table 2 and Table 3 for an operating voltage of 3.3V.
Wi-Fi Measurement
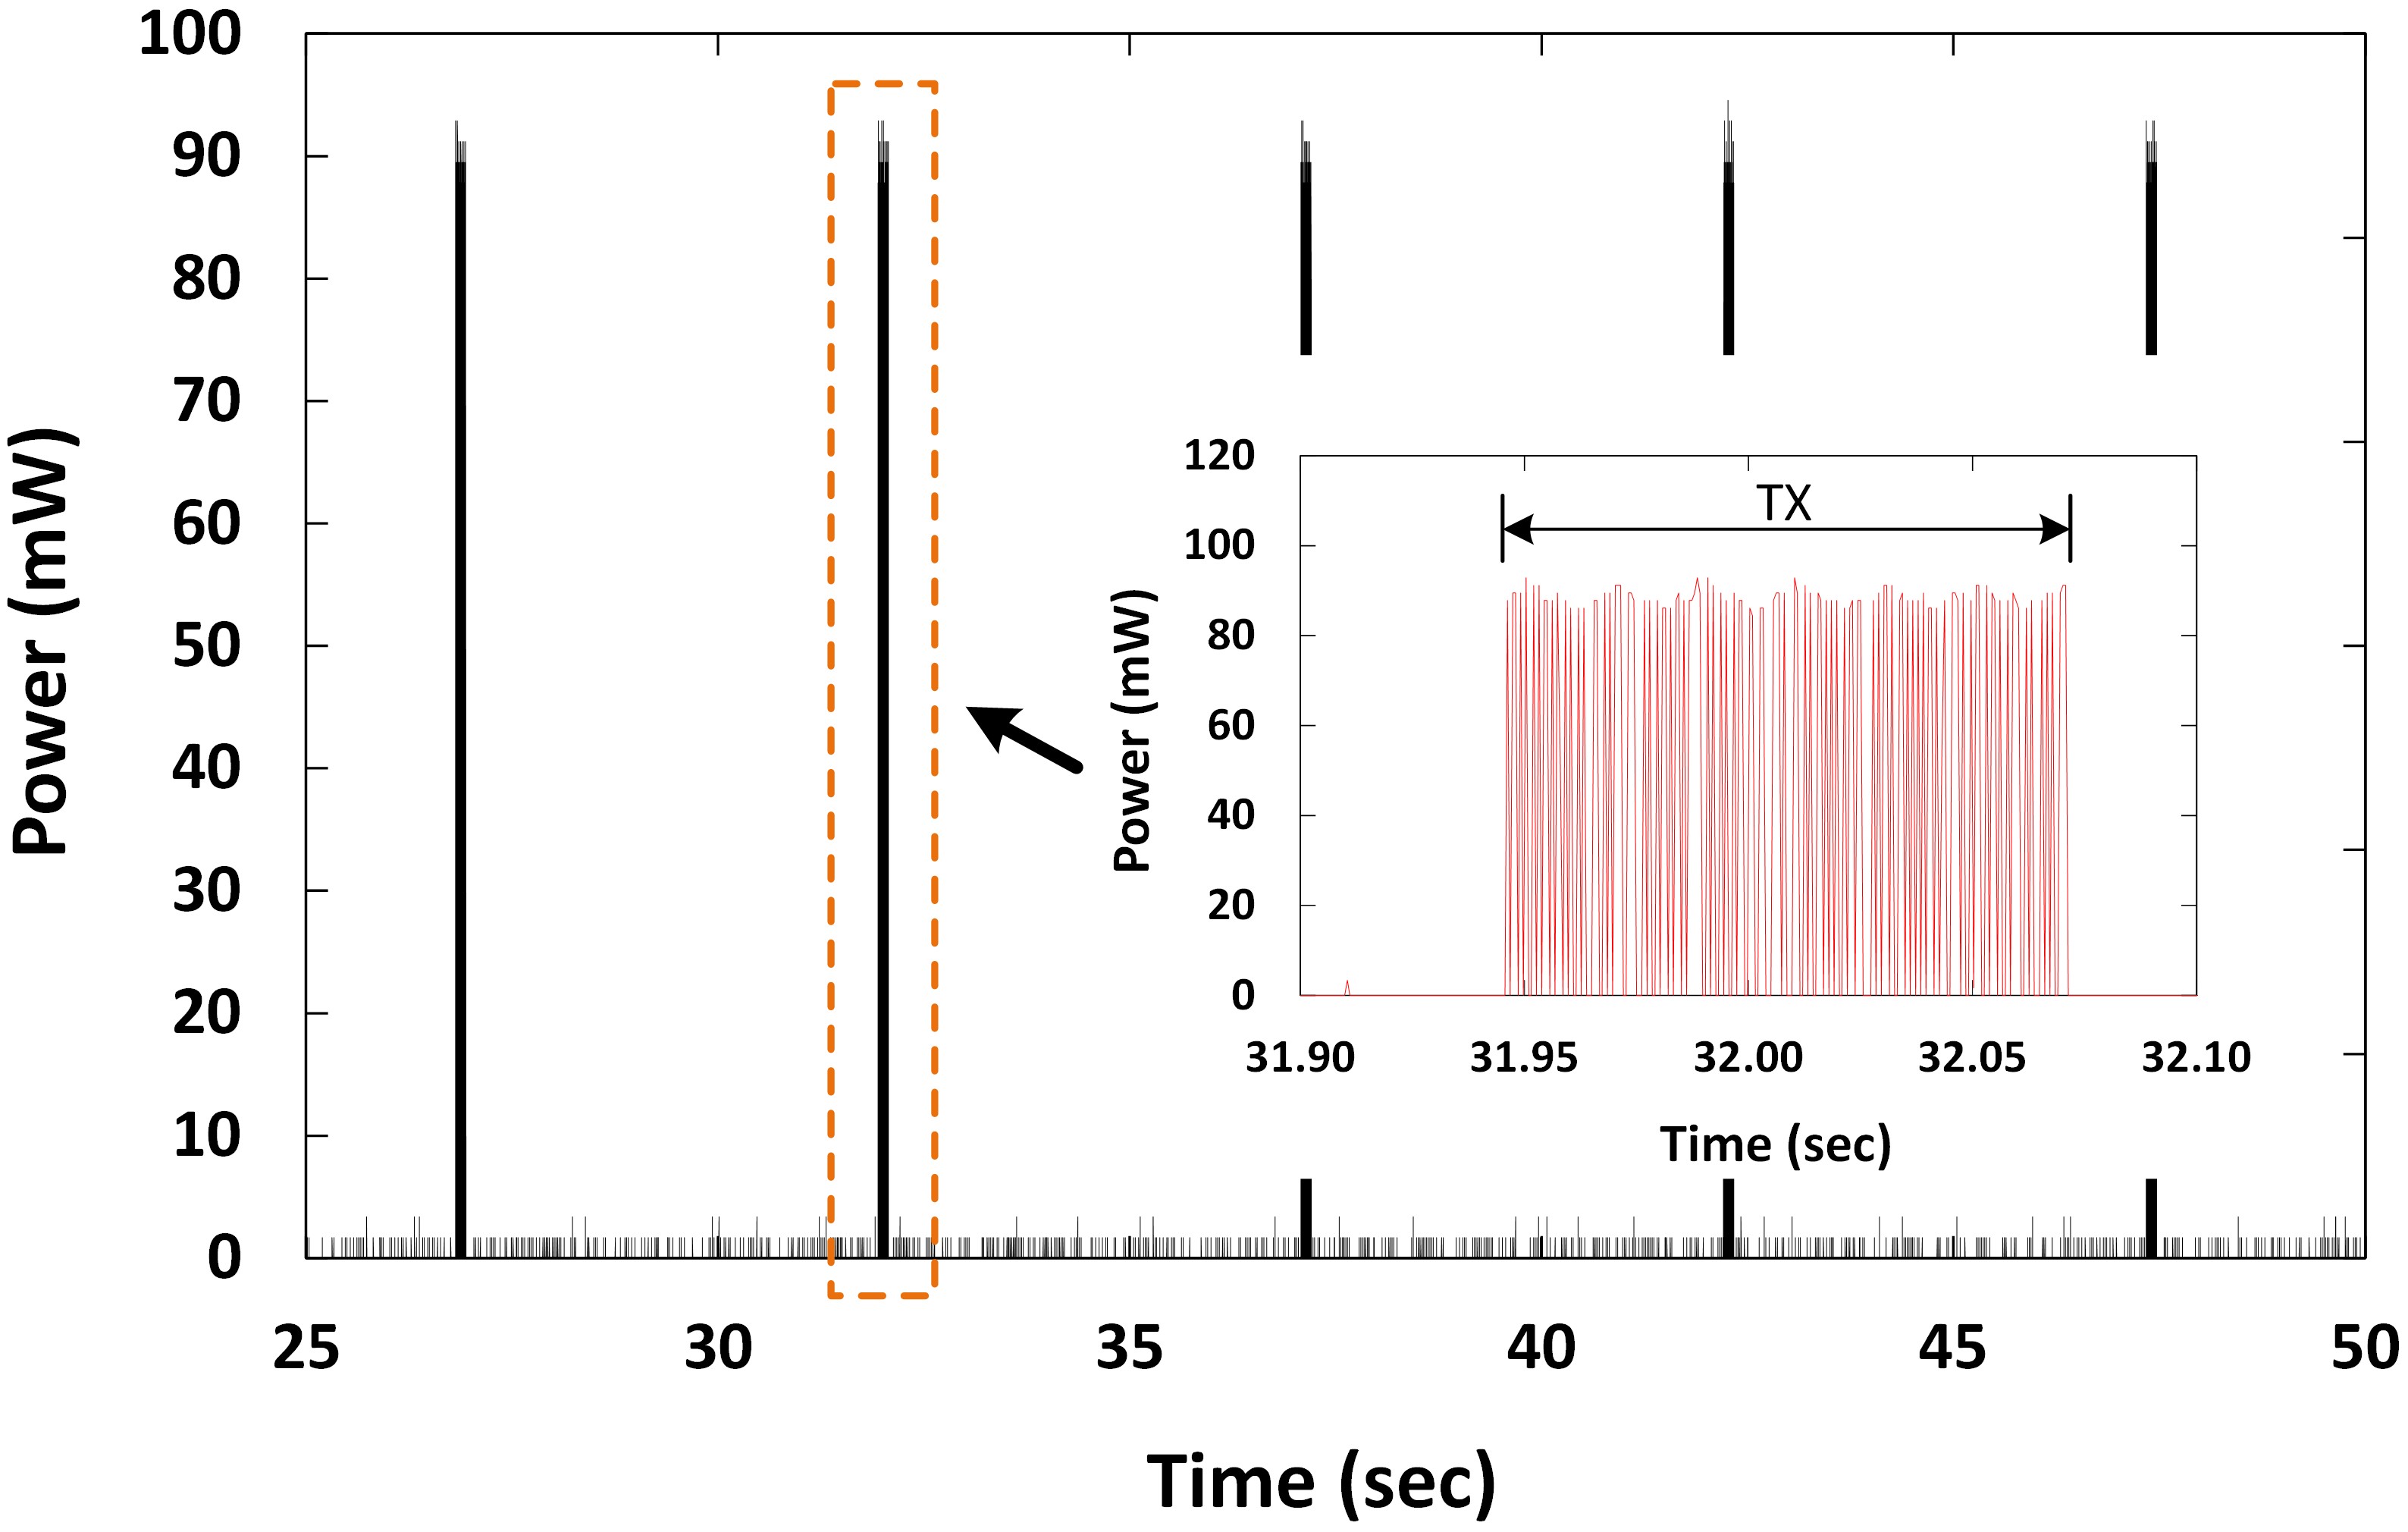
In measuring the Wi-Fi module, an infrastructure operating mode was used. The Wi-Fi module and the AP were configured for the IEEE 802.11g standard, with a maximum theoretical data rate of 54 Mb/s (the highest of all the RF modules considered). At start-up the Wi-Fi module scans the channels for periodic beacons from the AP before a connection process is initiated. Regular beacons are received from the AP at 100 ms intervals and a block of data is transmitted to the gateway every 3 sec. Figure 6 shows a power consumption plot of the ESP-12F module depicting the beacons and data transmit phase. (There is some variation in the magnitude of the initial spike, due to the brevity of the spike duration compared with the power meter sampling interval.) As with every TCP/IP process, Tx packets are followed by ACK. However, the Rx process is indistinguishable from that of the Tx in the figure. The Wi-Fi module power draw in different states is reported in Table 2 and their duration in Table 3.
Figure 6. Power consumption trace of ESP-12F Wi-Fi module.
RF433 Measurement
The RF433 transmitter and receiver modules were measured separately. Figure 7(a) shows the power trace of the 433 MHz Tx module sending 10 Bytes of data and Figure 7(b) shows the Rx module receiving the same amount of data at 5 sec intervals.
|
(a) |
(b) |
Figure 7. Power trace of an RF433: (a) transmitter module sending a 10 B message; (b) receiver module receiving the same amount of data.
The transmitter module consumes a small amount of power (â 0.03 mW) when in standby and about 45 mW on average when transmitting. This is depicted by the spikes in Figure 7(a), indicative of its on-off keying modulation. Table 2 and Table 3 list the power draw and duration values of the RF433 modules. Because the Tx and Rx modules lack an integrated MCU, there is no substantial wake-up time for the transmitter and very little for the receiver (about 3 ms). The receiver module, however, maintains a steady but relatively higher power consumption level (â29 mW) when in standby (i.e. listening mode), as can be seen from Figure 7(b). The RF433 module has the longest over-the-air transmission time due to its low data transfer rate (9.6 kb/s max), which is several orders of magnitude less than that of the other RF modules. Furthermore, while the Tx and Rx duration are similar for the same data transfer, the receiver remained at a higher power level for an additional duration of about 280 ms for post-processing or data verification.
Domestic Stock Control IoT Application â A Case Study
Application Architecture
The basic application architecture of the IoT is considered to include a large number of end devices (sensors and domestic appliances), communicating via a short-range wireless medium to a gateway device (a âhome gatewayâ) and being controlled by that gateway. In some cases, the home gateway will communicate through an external network with cloud-based applications. While the popular wireless interface options discussed in the preceding sections have propagation or performance characteristics that may be important in particular applications, the focus of this case study is on the energy efficiency of each option in the context of a domestic operational paradigm, with short messages communicated over a range of a few metres.
As an example, we consider a simple domestic stock control application, in which a toaster reports to the home gateway the number of bread slices it has toasted up to a particular time. Coupled with reporting of the bread quantity when it first enters the household (and other events), this could enable automated stock control and replenishment of bread supply by a commercial supplier. This application is simple enough for a straightforward analysis of energy consumption while encompassing all the major design features. Whilst it may seem to be an unusual choice, the toaster is considered the first connected domestic âthingâ in the IoT (Oweis et al., 2016).
To support this application, a wireless communications interface must be added to the toaster, assuming that the home gateway is already equipped with suitable interfaces. The toaster interface will consume power in addition to the normal operation of the toaster and will, in some circumstances, add a few percentage points to the energy consumption over time. For this application, it is assumed that the gateway is within the âsmart kitchenâ so that the communication range is a few metres at most. The toaster need only report the number of slices of toast in a given period, so the payload is only a few bytes. All the measured wireless options are capable of providing the necessary range and throughput. The energy consumption of the application over a period of one week is considered.
Communication Paradigms
There are three basic communications paradigms, which have different energy implications. These are:
- Broadcast;
- Polling;
- Event-driven.
In each instance, we assume that the communications interface is in sleep or standby mode until it wakes up (or is woken up by a polling request), transmits its data, receives an acknowledgement (if possible), and goes back to sleep or standby mode.
Which of these communications paradigms uses the least energy for a specific wireless interface depends both on the relative energy usage of the interface in its various states and on the frequency of use, that is, on the traffic at the toaster. No one communications paradigm is optimal over the full traffic range.
Broadcast Mode
In Broadcast mode, the toaster reports its status (number of bread slices toasted) at regular intervals (e.g. every hour). The communications interface of the toaster will be active periodically, perhaps frequently. Because the application will require reliable communications between the toaster and the gateway, the communications interface will remain active after wake-up from its sleep or off state until an acknowledgement has been successfully received (if possible). It can then return to an inactive âsleepâ state until the next communications cycle.
In Broadcast mode, the natural cycle adopted for this application is once per hour: i.e. the stock control algorithm determines when more bread will be required and schedules a delivery at some future hour.
Polling Mode
In Polling mode, the gateway asks the toaster at particular times to report its status and the toaster does so. The communications interface should be in a listening state at all times and should become fully active when a polling request is received. When responding to a polling request, the communications interface is fully active until an acknowledgement has been successfully received. It can then return to a listening state.
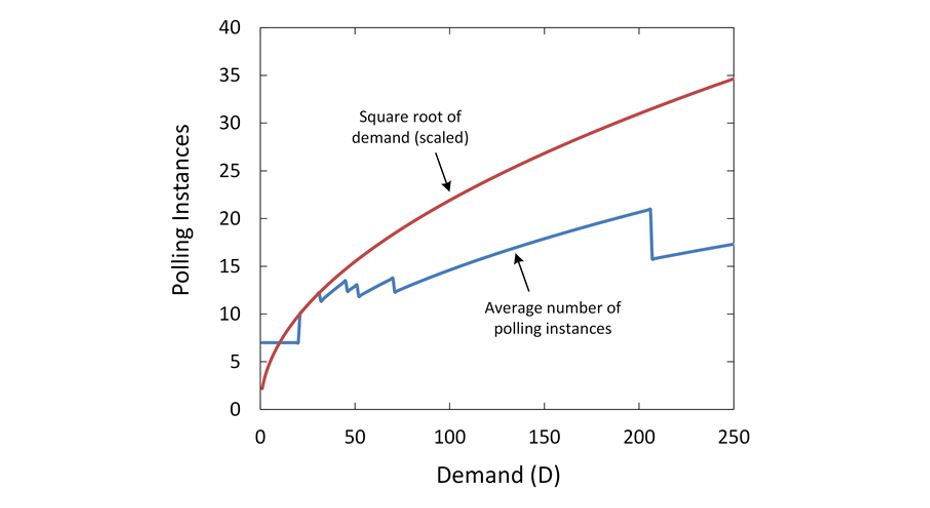
The Polling mode is assumed to be governed by a standard stock-control application in which the economic order quantity (EoQ) is proportional to the square root of the demand, i.e. EoQ = k*sqrt(D), where D is the demand and k is a constant (see, for example, Corke (1977)). Figure 8 shows a plot of polling instances against demand. The red curve is a scaled square root of demand and the blue curve is the average number of polling instances. Given the assumption of EoQ, the next polling event is set at one-half of the estimated time to exhaustion of bread supply, with the restriction that polling should be no more frequent than once per hour and no less frequent than once per day. (These constraints give rise to the steps in the figure.)
Figure 8. Plot of polling instances against demand.
This is a minimal polling design: a âsimplerâ design (e.g. polling once per hour) could generate many more polling events. In this design, the toaster is polled only once per day for low numbers of toasting events. The number of polling events increases only as the square root of demand and, with a suitable value of k, can be kept below 25 polling events per week even for large numbers of toasting events.
Event-driven Mode
In Event-driven mode, the toaster reports only when a toasting operation begins. The toaster interface becomes fully active when a new slice of bread is introduced to the toaster. It remains active until an acknowledgement has been successfully received (or communication is deemed successful) before returning to inactive state. The number of events is usage driven.
Energy Consumption Model
The main operational modes of the wireless interfaces (RF modules) for which power consumption measurements were conducted are:
- Inactive or sleep mode â in cases without explicit sleep mode, this is when the interface is turned off;
- Wake-up mode â Transitions between sleep and active and from active to inactive;
- Listening or standby mode â when the interface can detect and receive a message but may not be able to transmit;
- Transmit (Tx) mode â when the interface is transmitting data;
- Receive (Rx) mode â when the interface is receiving data.
Energy Consumption Calculation
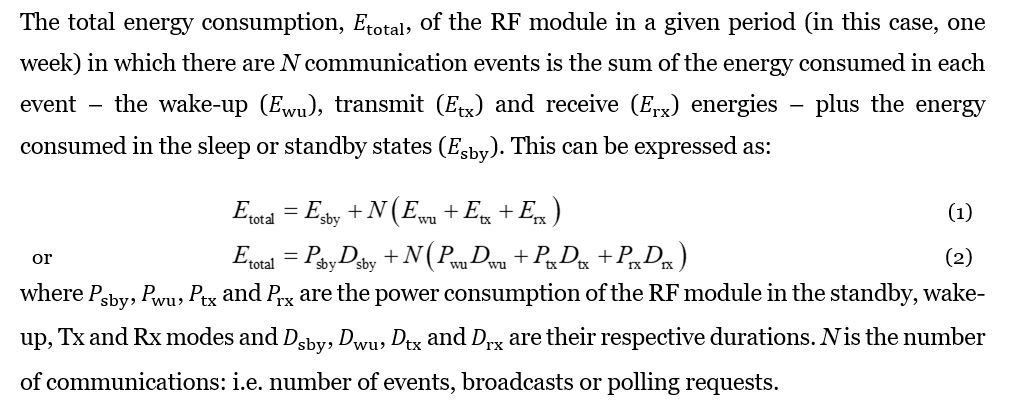
We use the power draw and duration measurements given in Table 2 and Table 3 for each RF module. The calculated energy is the product of the power draw and duration.
With polling communication (home gateway to end-device), the RF module remains in standby state in order to detect incoming packets. Therefore, BT (in sniff mode) and RF433 with no sleep-mode capability will stay in the listening mode when not communicating. In a weekly cycle, the time taken in listening mode is the total weekly period (604,800 seconds) less the time for all transmissions. BLE, Wi-Fi and ZigBee do have sleep-mode options. However, only ZigBee with its reverse polling technique can utilize its sleep-mode (end-device to home gateway), sending requests to its coordinator/master at regular intervals after wake-up. BLE and Wi-Fi, at minimum, require their receivers to remain active, which prevents an effective sleep-mode.
When designed for broadcast-only communication, a 10 B payload is sent by the end-device (toaster) once every hour. Consequently, there will be 168 transmissions (N = 168) per week irrespective of the frequency of toast slices made.
In an event-driven communication, however, the energy consumed by the modules scales linearly with the number N of toast events. The energy consumption of a BT module is greatly influenced by the time required (see Table 3) to power on and re-establish connection with the master/coordinator. An average of 640 ms was measured for a complete inquiry scan and advertisement (stages of BT protocol), assuming that the interface is completely turned off at the end of each transmission. It takes an average of 1836 ms for the BT wake-up phase (including turn on, inquiry scan, paging and synchronization) during which the HC-06 consumes an average of 96 mW. Similarly, the Wi-Fi module spends about 5.5 ms in the wake-up phase but with much higher average power consumption (412 mW).
Processing and Storage Energy
A simple IoT hardware application like the toaster example requires some processing and storage of data bits. Although the main focus of this work is on the measurement and assessment of the communication energy consumption, an IoT toaster needs some memory to store toast counts, which can be incremented step-wise until its reset point. It is therefore necessary to consider its potential processing and storage energy usage.
For the same MCU and clock crystals on a circuit board, the processing energy usage may be small but similar for the three communication methods. With regard to storage, while an event-driven method may not necessarily require storage, the broadcast and polling methods do. Recent RF modules are commonly designed as a SoC, with a few kilobytes or megabytes of static random access memory (SRAM) or NAND flash memory. For example, the toaster could be designed with a 32-bit ARM Cortex M4F MCU (as in Nordic (2017)), which has 64 KB SRAM and 512 KB flash memory. The M4F consumes 1.2 µA (2V operating voltage) in a low-power state with full SRAM retention. Hence, a toaster may consume about 1.5 J per week to retain the toast count data of less than 10 B, which is far smaller than the capacity of the SRAM. Utilizing flash memory, on the other hand, does not require power to retain data (non-volatile). A study by Lee & Chang (2003) shows that a NAND flash memory consumes 4.72 µJ and 38.04 µJ to read and write data, respectively, to a 2 KB memory page within a 128 KB memory block. For 250 read/write operations, a flash memory may consume as much as 10.7 mJ of energy. The choice of memory is dependent on the type of application, the frequency of data requests and amount of data per operational duty cycle.
We can, however, conclude that the energy use for running the processor and storing or retaining the data bits is small and can be ignored if flash memory is utilized for this application.
Comparison of Energy Consumption
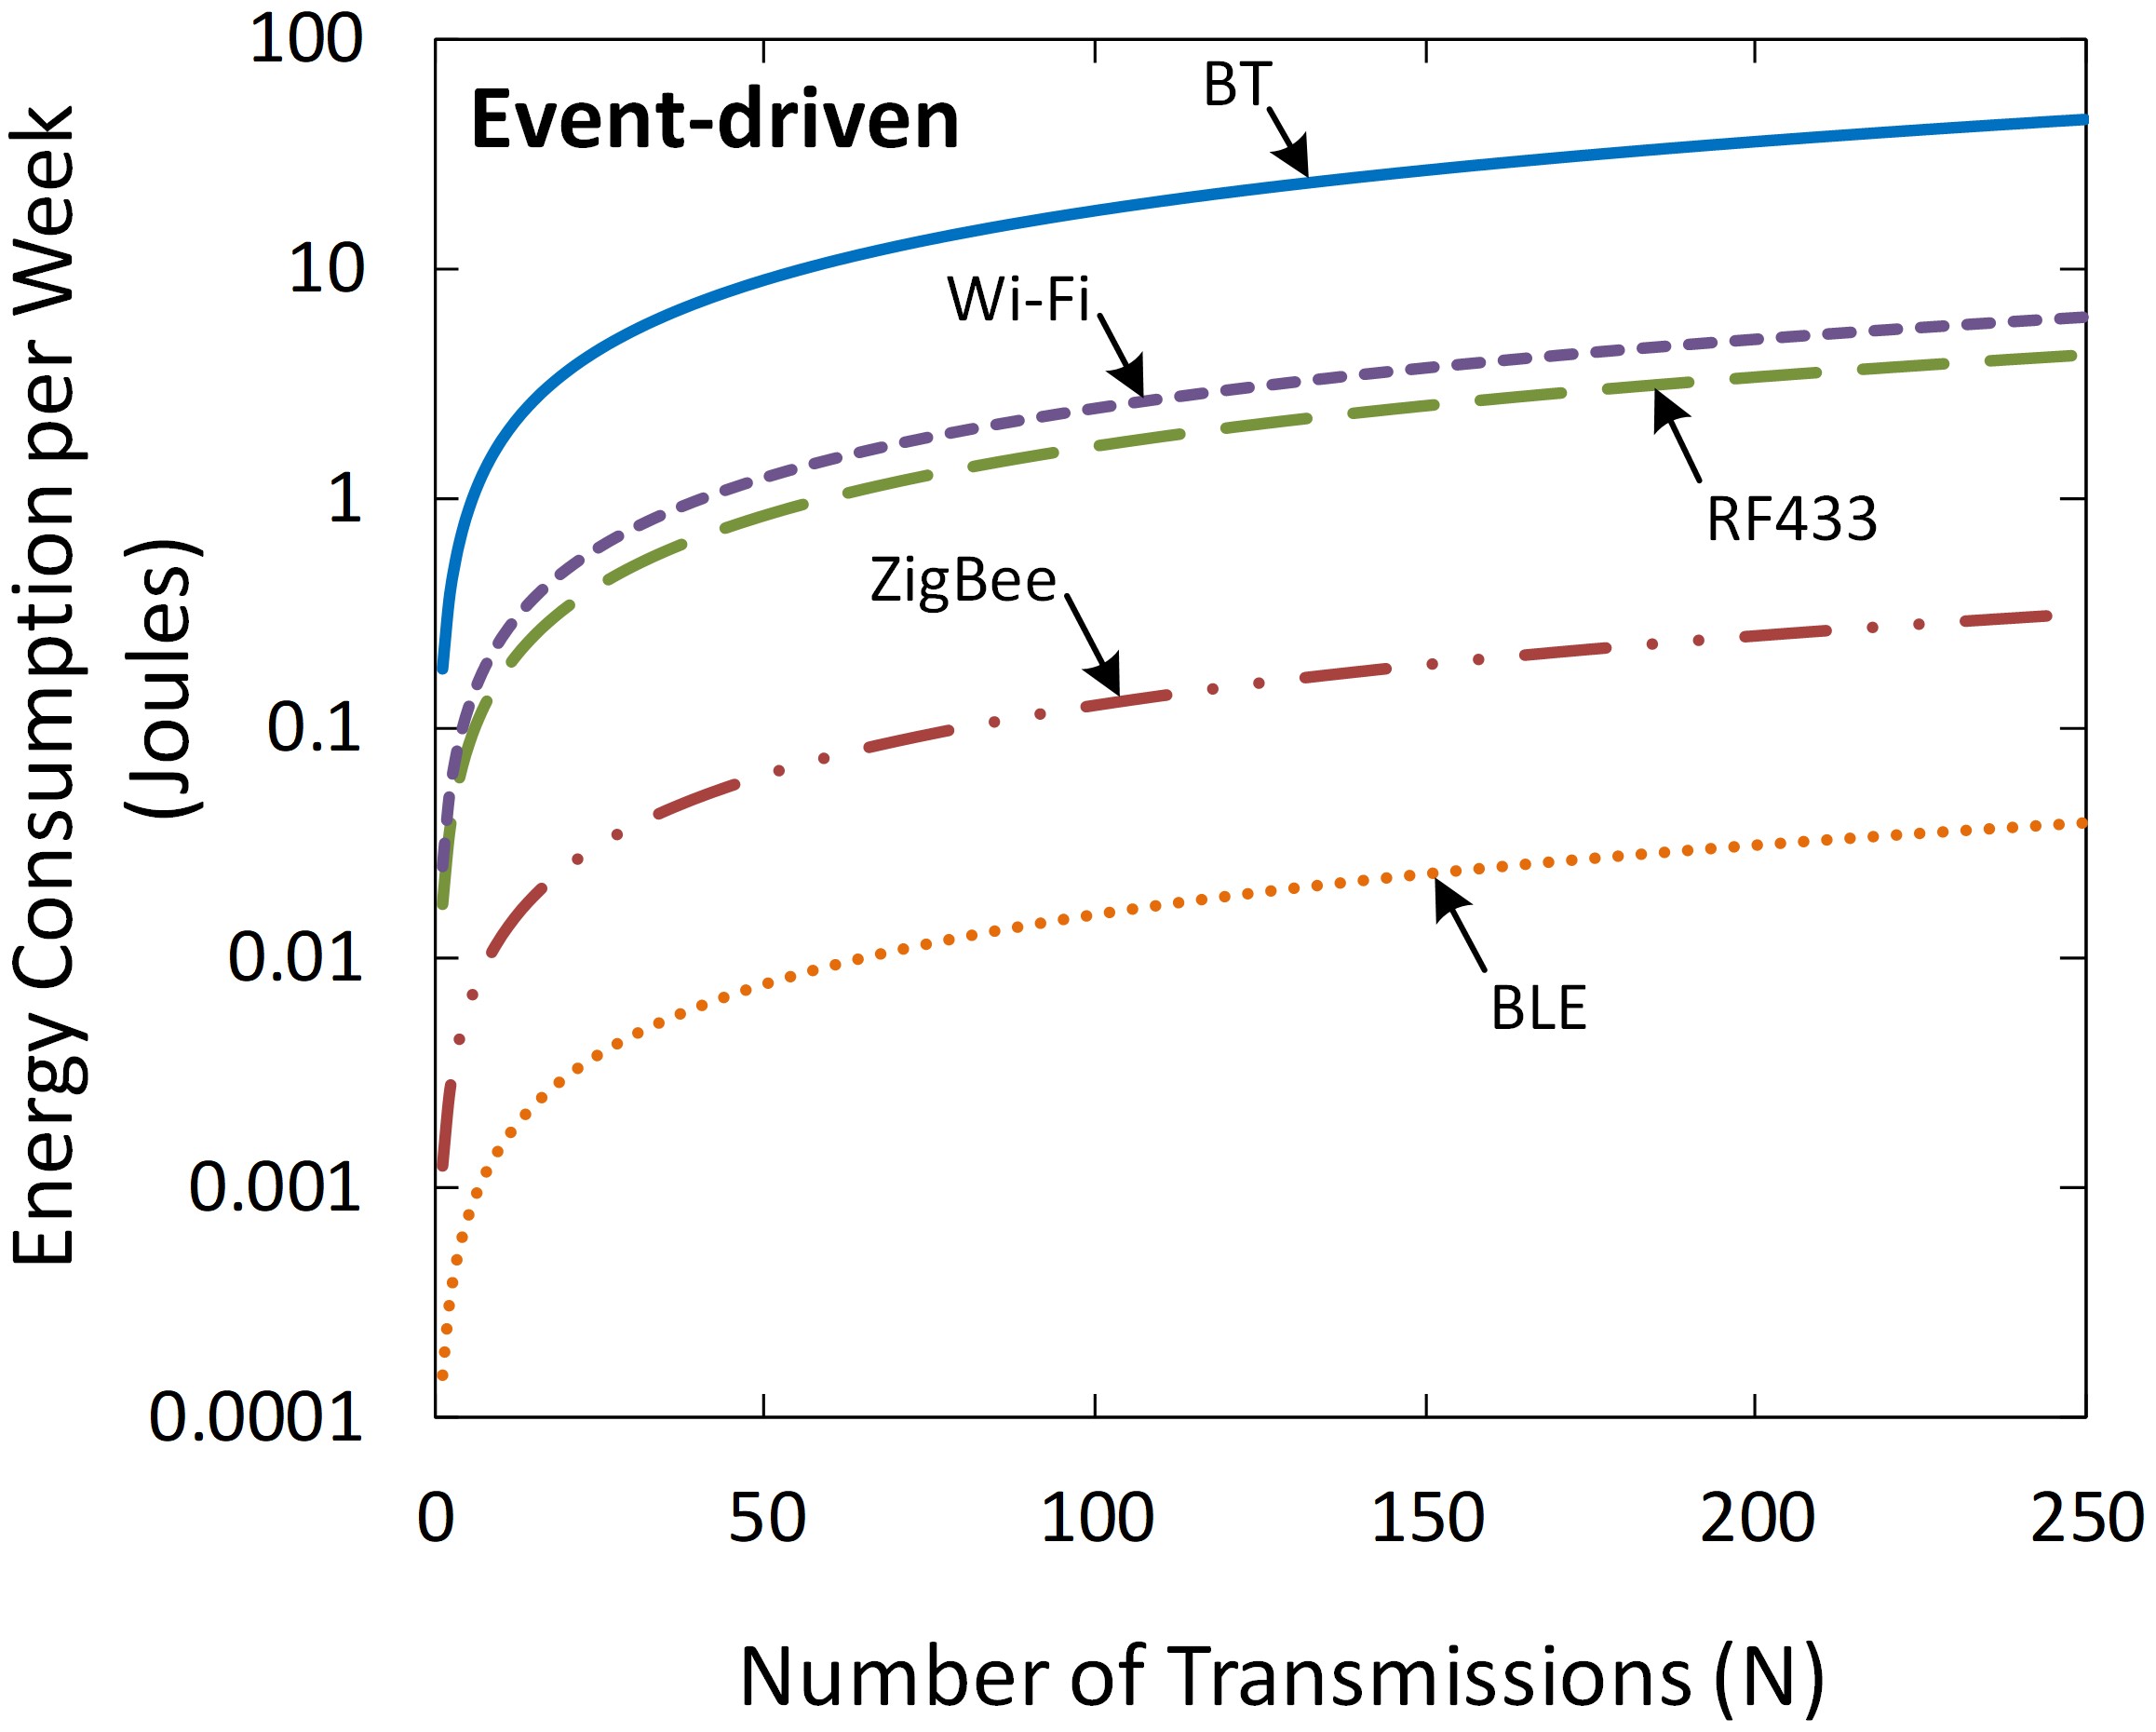
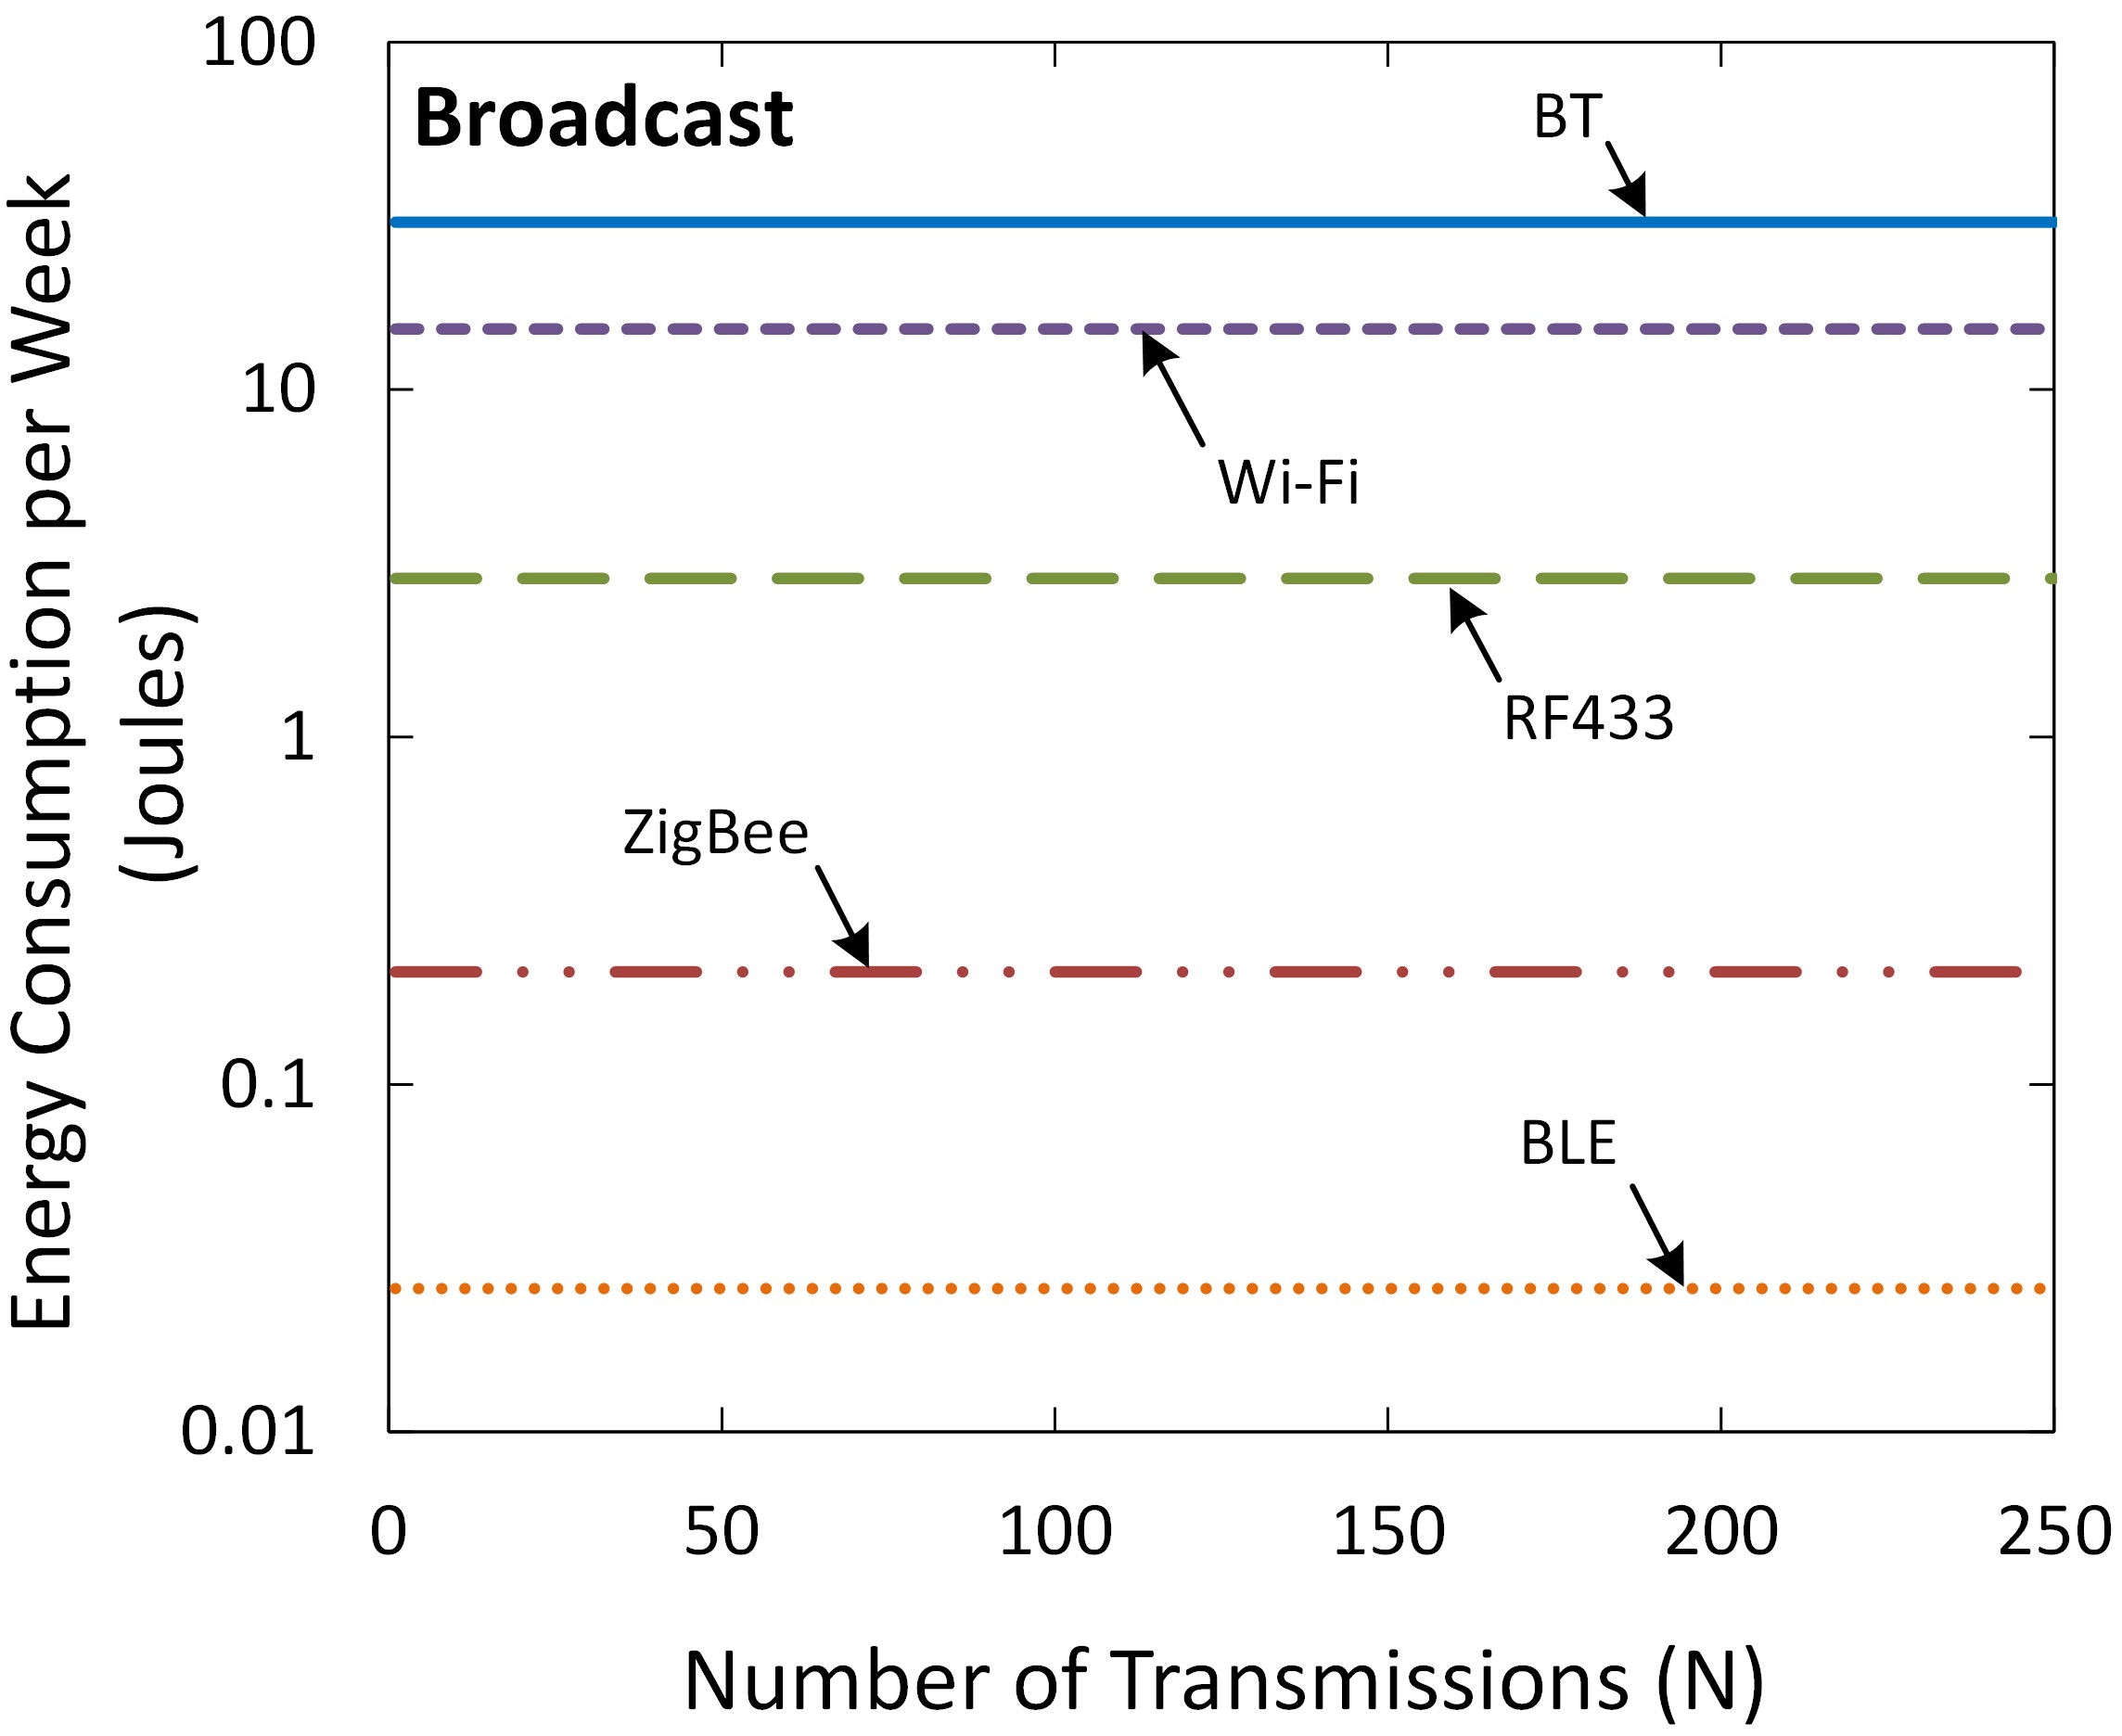
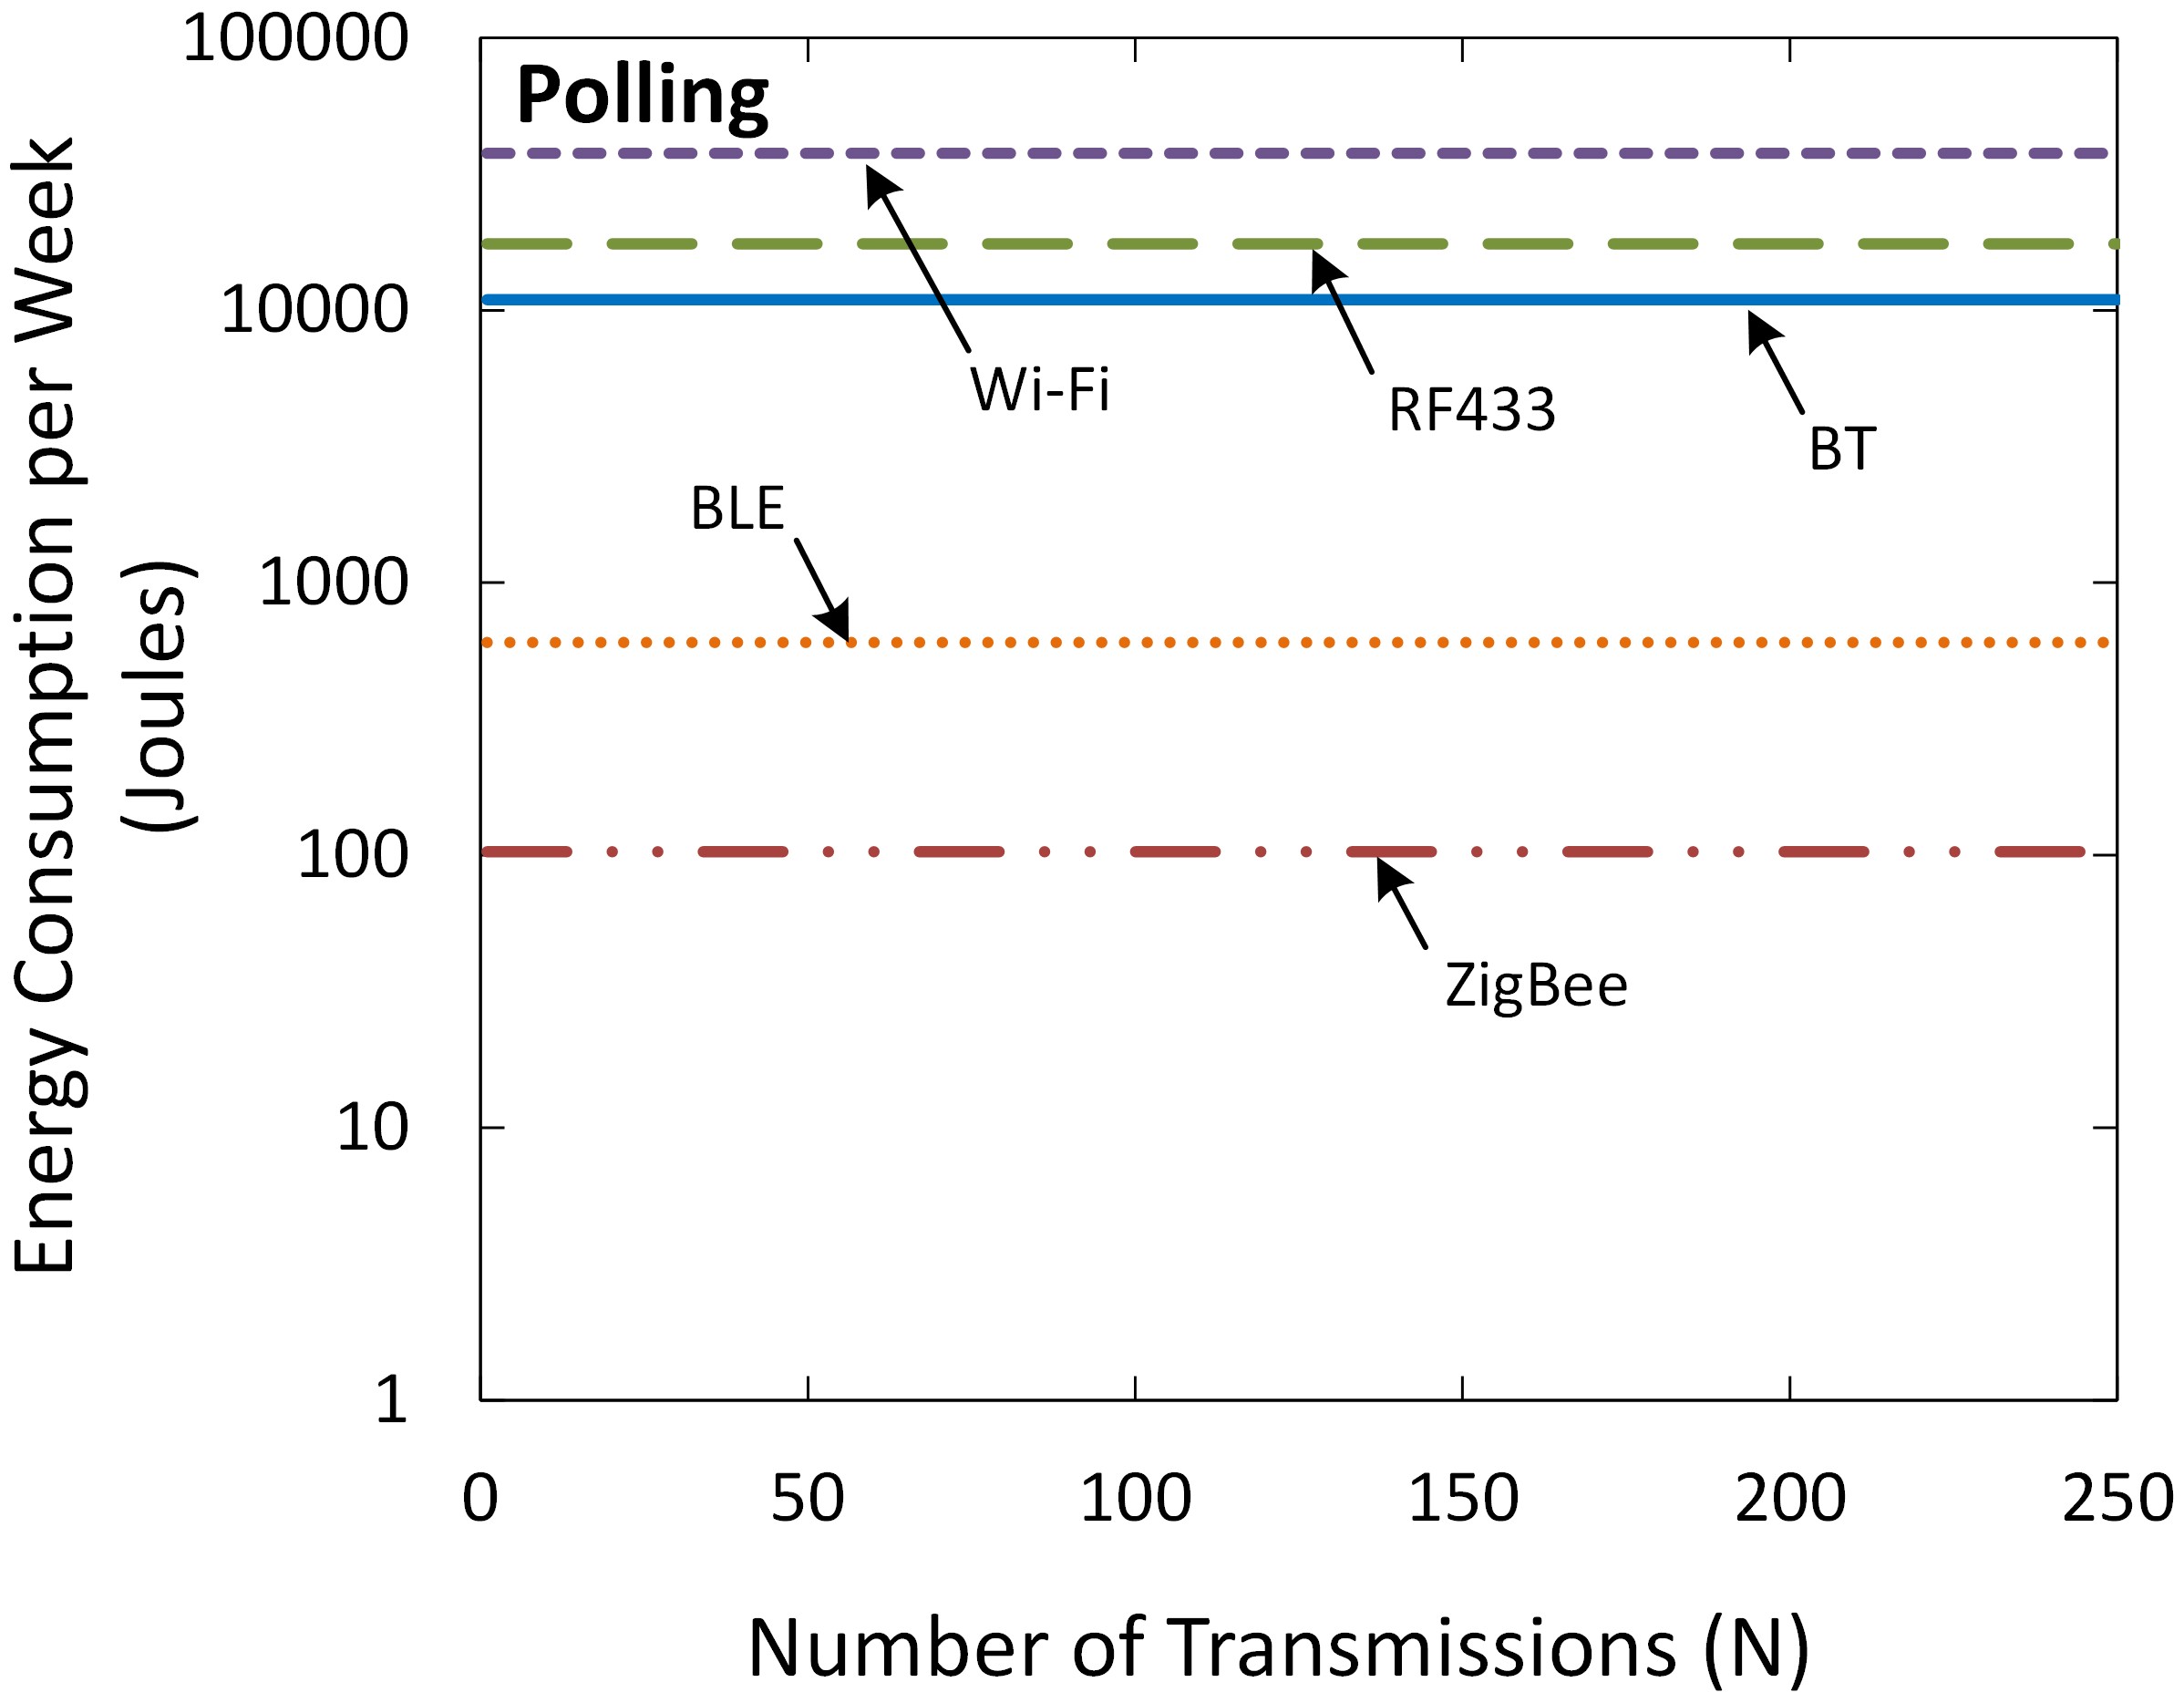
The plots in Figure 9 show the weekly energy usage comparison of BT, BLE, ZigBee, Wi-Fi and RF433 for the three communication paradigms considered in this study. For event-driven and broadcast modes, it is assumed that the interface is turned off between events. For the event-driven and broadcast modes, the BT module is the most energy hungry, while Wi-Fi is most energy demanding for Polling mode. BLE is the most energy-efficient for all but one (i.e. Polling) mode. ZigBee is more energy-efficient than BLE for polling due to its reverse polling capability. This allows the ZigBee module to sleep for longer periods while BLE periodically listens to the home gateway for polling requests. This result demonstrates an incentive for the communication to be driven by the end-device.
|
(a) |
|
(b) |
|
(c) |
Figure 9. Energy consumption per week for BT, BLE, ZigBee, Wi-Fi and RF433 using communications paradigms (a) Event-driven, (b) Broadcast, and (c) Polling.
Whilst it is energy-wise (visibly from Figure 9(a)) to choose event-driven mode for lower usage rates, the broadcast mode is more energy-efficient beyond 168 servings per week. The energy usage of polling mode, however, is several orders of magnitude higher than both broadcast and event-driven modes, since the RF modules must stay in standby mode to receive incoming polling requests from the home gateway. Note that the variation of the polling energy numbers is masked on the plot due to the use of a logarithmic scale.
As an example, if toasting 20 slices of bread in a week, the BT interface, configured in polling, broadcast or event-driven mode, will consume 10.9 kJ, 30.3 J or 3.6 J, respectively. Hence polling mode uses just over 3000 times more energy ( 10000 times more for Wi-Fi at 38 kJ) than event-driven mode. To put this in perspective, an 800 W toaster will consume 72 kJ of energy in one toasting operation (1.5 minutes average toasting time). Hence, the weekly energy consumption of an always-on Wi-Fi interface added to a toaster, is equivalent to about 5% of the total energy consumed for toasting 20 slices of bread for a week, assuming 2 slices per toasting event.
Energy-Efficient Design
This section draws some conclusions about energy-efficient design using the application architecture from the above section and the power measurements reported in Table 2. In particular, we show that the most energy-efficient communications paradigm for each wireless interface depends on the number of events reported (or amount of traffic) over the interface.
Interfaces Always On
The comparisons in the preceding section indicated that polling is not an energy-efficient option. This assumed, however, that the interfaces would be turned off between events in event-driven and broadcast modes. A naive design would just add a standard wireless interface to an end-device and assume that the interface is always on. Figure 10 shows the total energy per week used by an RF433 interface with the three communications paradigms if the RF module stays on the entire time. In this case (and in general, if the interfaces are always on), event-driven communication is preferred in the case where the number of transmission events is very small. Once the number of events exceeds a threshold (about 7 for this example), polling mode is more energy efficient. Broadcast mode will eventually become the most energy efficient mode when the number of servings is very large (not shown in the figure).
Although this is a somewhat contrived example, it shows that the energy-efficient design of the local wireless communications for the Internet of Things can depend on the choice of wireless interface, the number of communications events and the amount of traffic (or application) to be carried.
Figure 10. Energy consumption per week of an RF433 interface (Always On).
Interfaces Powered Down When Not In Use
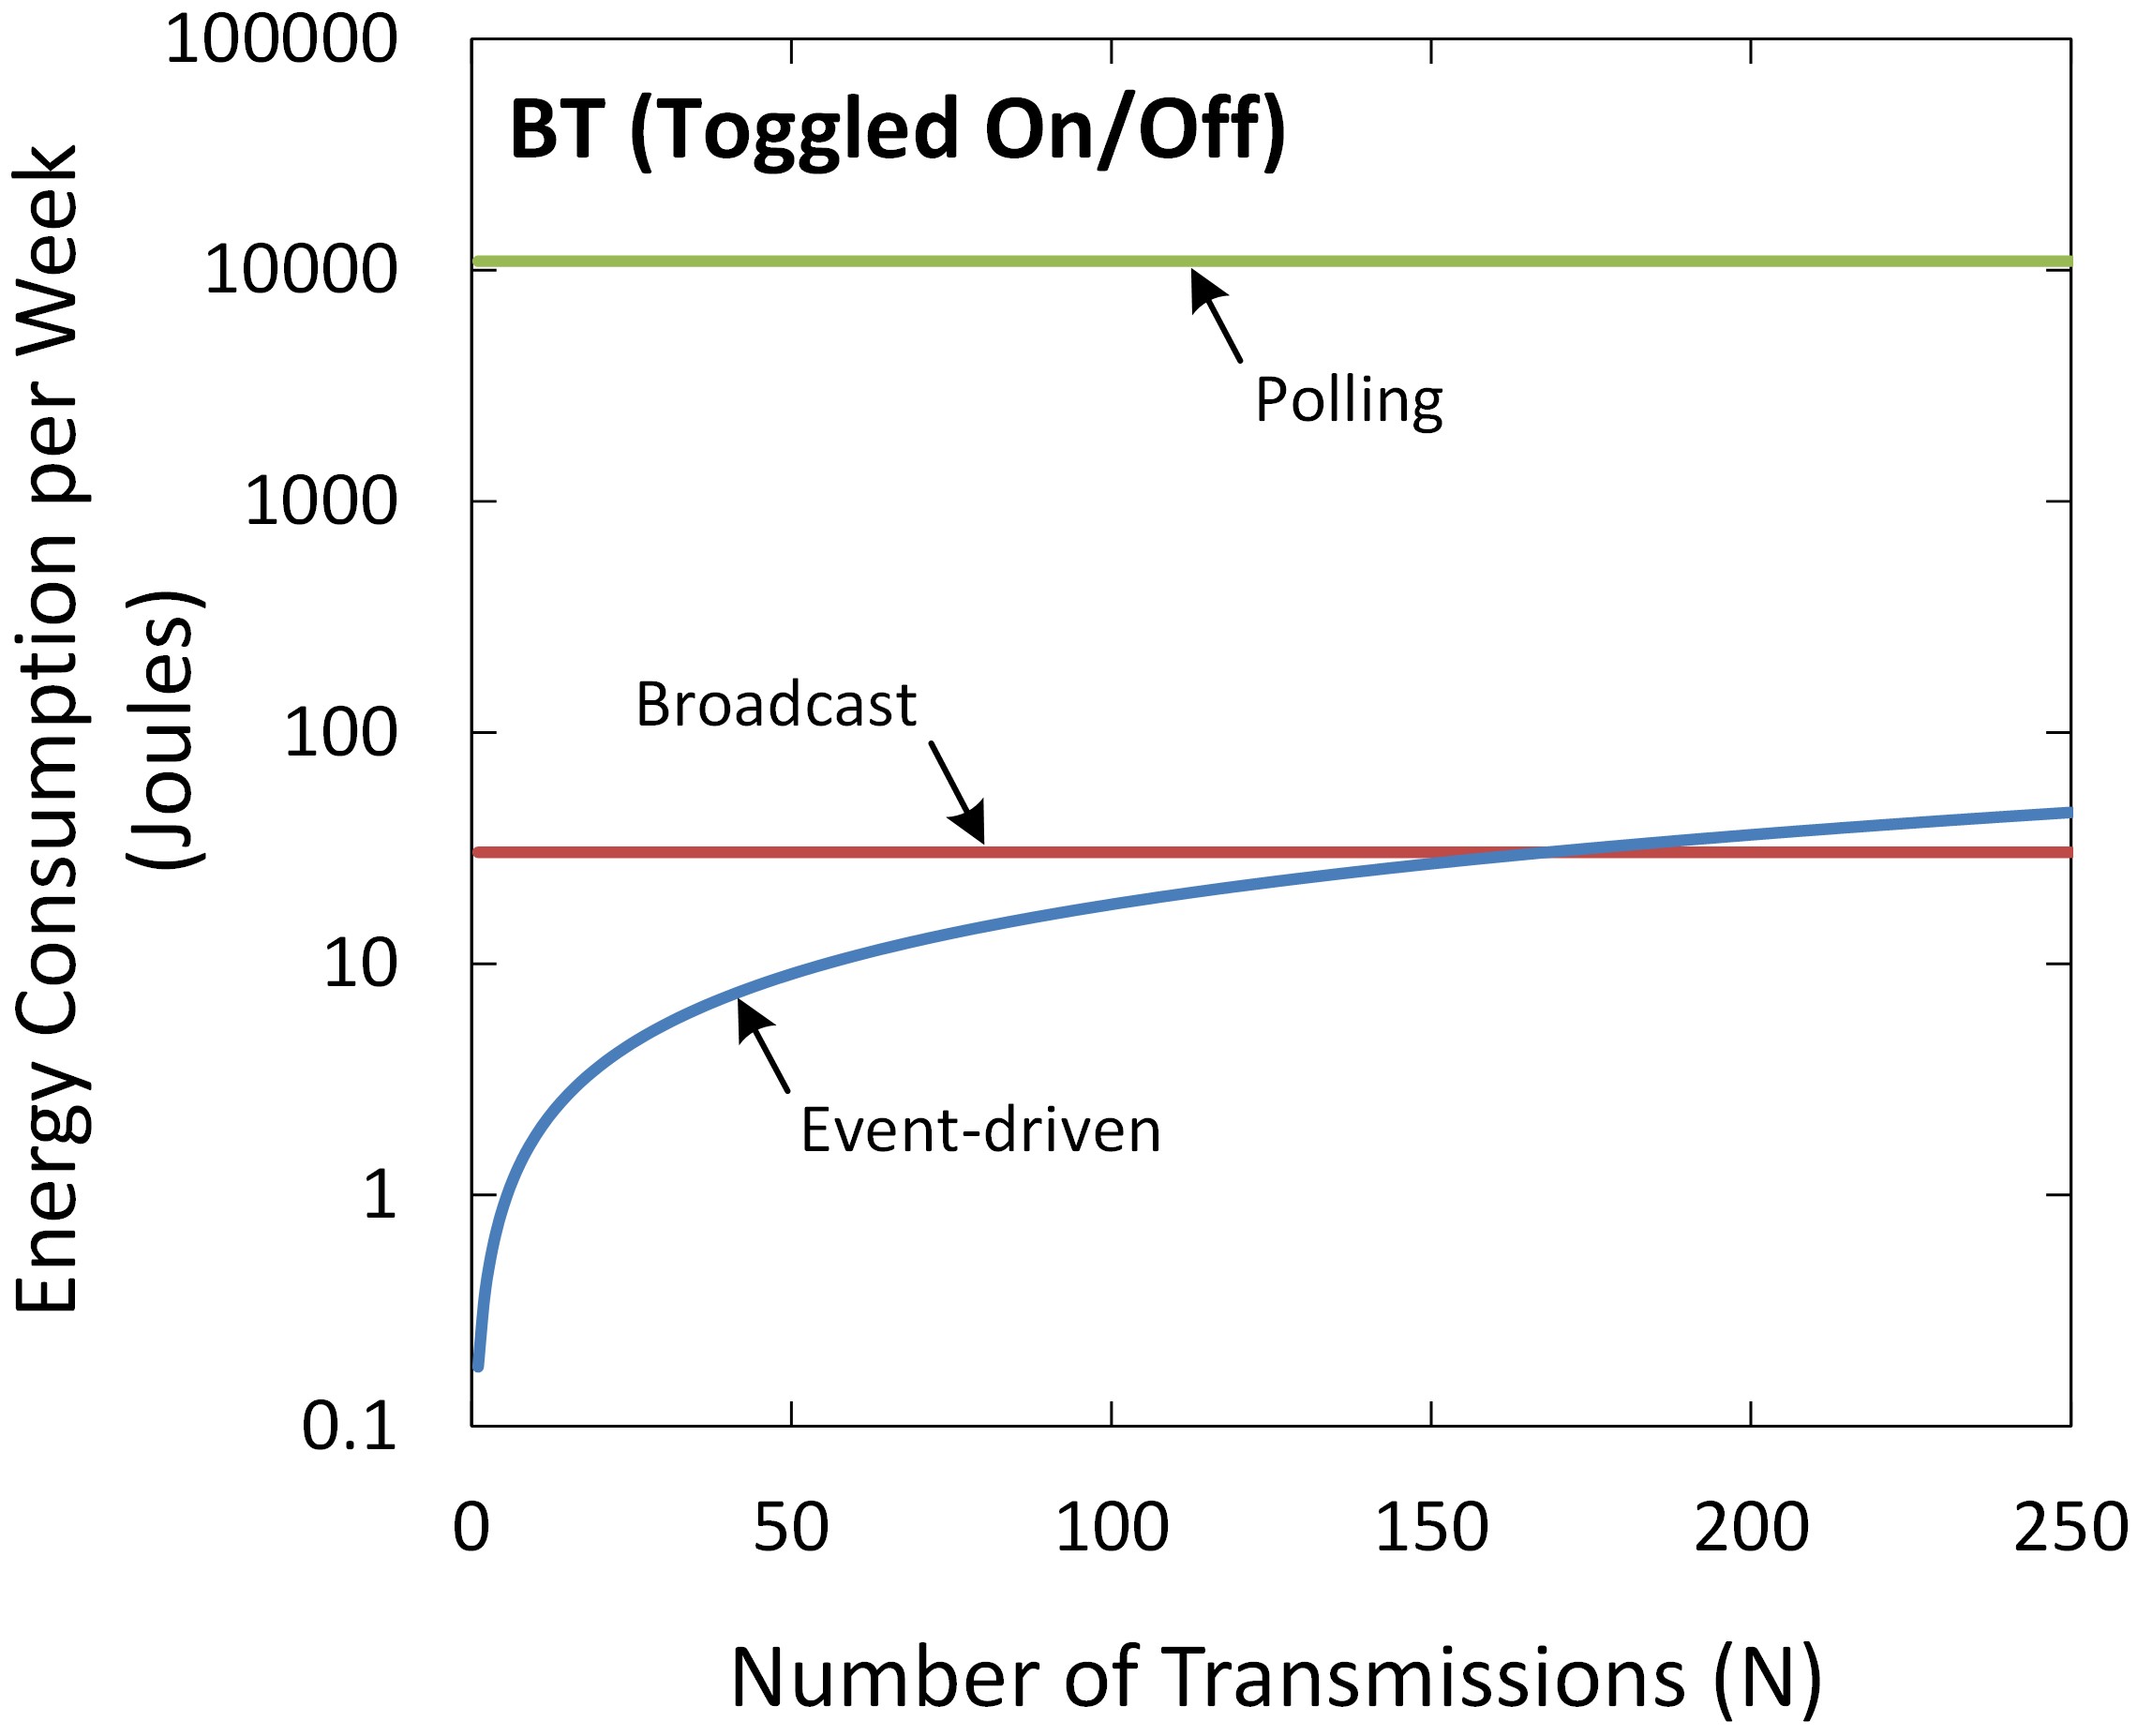
For most traffic levels, sleep mode is important for energy-efficient communications. For very high traffic levels, always-on polling will eventually be preferable to event-driven communication but, in this case, broadcast will be the most energy-efficient paradigm. Figure 11 shows the total weekly energy used by a BT interface when toggling on/off in the broadcast and event-driven modes. (Note the logarithmic scale in order to accommodate all three communication modes.) In this case, the event-driven mode is preferred until the amount of traffic exceeds that of the constant hourly broadcast, after which broadcast mode is preferred.
Figure 11. Energy consumption per week of the BT interface (toggled on/off).
Conclusions
In this paper we have measured the energy consumption of representative samples of five popular wireless interfaces when they are in their inactive, listening, transmitting and receiving states. Using these measured values, we have calculated the total energy usage for three different communications paradigms â broadcast, polling and event-driven, in one (somewhat undemanding) application. In each case, it has been shown that the most energy-efficient communications paradigm depends both on the relative energy usage by the interface in its various modes and on the frequency and volume of traffic transmitted over the interface.
For any particular IoT application, the designer has a range of choices in terms of the communications paradigm and of the communications hardware to employ. This paper has shown that it is important to consider the interplay between these and the design of the application itself, in order to achieve an energy-efficient solution.
Our results suggest that, for an IoT application developer, careful consideration of the applications to be run over the wireless interfaces will be required to determine an energy-efficient design. In many cases, the level of traffic will be uncertain (or will change over time). The results suggest that applications should be designed to adapt to traffic levels by selecting a different communications paradigm when it becomes more energy efficient to do so. It would be beneficial if IoT communications protocols were easily adaptable for changes in communications paradigm or, equivalently, traffic levels.
Note also that a least-capital-cost solution may not be the most energy efficient (and hence the least cost over the lifetime of the interface). Bluetooth and Wi-Fi interfaces, for example, may be lowest cost and most readily available because of their volume production, but may consume more energy than alternatives. Their many communications features may also be of no benefit for the specific application for which the communications interface has been added. A design process that takes into account total cost of ownership (including both initial and operating costs) will be preferable.
In terms of the technology choices themselves, it is clear from the values in Table 2 and Table 3 that BLE and ZigBee provide significant energy savings over classic Bluetooth and Wi-Fi. In our measurements, BLE outperforms ZigBee in all instances, suggesting that BLE should always be preferred for the type of single-hop, short-range communication considered here. RF433 remains a competitive low-energy option if the interface can be in Sleep mode most of the time (as in the case, for example, of a temperature sensor). WiâFi and Bluetooth, on the other hand, should only be used if their range or other characteristics are required for the application under consideration.
Whilst the actual devices measured are representative of what is on the market today, these consumption values will most likely change over time. That notwithstanding, the principles outlined here can be employed in designing efficient interfaces for IoT appliances.
Acknowledgement
The authors would like to thank Professor Rodney Tucker for his guidance and helpful comments as research supervisor of the first author.
References
Arduino (2009). Arduino Duemilanove. Available from: https://www.arduino.ccâ/en/Main/arduinoBoardDuemilanove
Atzori, L., Iera, A. & Morabito, G. (2010). The Internet of Things: A survey. Computer Networks, 54(15), 2787-2805.
Bluetooth-SIG. (2010). Bluetooth Core Specification 4.0 - Bluetooth Low Energy. Available from https://www.bluetooth.com/specifications/archived-specifications .
Bluetooth-SIG. (2019). Bluetooth Core Specification 5.1. Available from https://www.bluetooth.com/specifications/bluetooth-core-specification .
Corke, D. K. (1977). Production control in engineering. London: Edward Arnold.
Dementyev, A., Hodges, S., Taylor, S. & Smith, J (2013). Power consumption analysis of Bluetooth Low Energy, ZigBee and ANT sensor nodes in a cyclic sleep scenario. 2013 IEEE International Wireless Symposium (IWS), April, Beijing, China.
Digi (2011). XBee & XBee-PRO ZB: ZigBee Embedded RF Module Family for OEMs. Available from: https://www.digi.com/hottag?ht=/pdf/ds_xbee_zigbee.pdf
Ferro, E. & Potorti, F. (2005). Bluetooth and Wi-Fi wireless protocols: a survey and a comparison. Wireless Communications, IEEE, 12(1): 12-26.
Gray, C. & Campbell, L. (2016). Should my toaster be polled? Towards an energy-efficient Internet of Things. 2016 26th International Telecommunication Networks and Applications Conference (ITNAC), Dunedin, New Zealand.
Hsu, C. F., Liao, H. Y. M., Hsiu, P. C., Lin, Y. S., Shih, C. S., Kuo, T. W., & Liu, J. W. (2006). Smart pantries for homes. 2006 IEEE International Conference on Systems, Man and Cybernetics, 5, 4276-4283, October.
James, R. (2014). The Internet of Things: A Study in Hype, Reality, Disruption and Growth. Available from: http://sitic.org/wp-content/uploads/The-Internet-of-Things-A-Studyin-Hype-Reality-Disruption-and-Growth.pdf .
Jin-Shyan, L., Yu-Wei, S. & Chung-Chou, S. (2007). A Comparative Study of Wireless Protocols: Bluetooth, UWB, ZigBee, and Wi-Fi. IECON 2007. 33rd Annual Conference of the IEEE Industrial Electronics Society, 2007.
Lee, H. G. & Chang, N. (2003). Energy-aware memory allocation in heterogeneous non-volatile memory systems. Proceedings of the 2003 International Symposium on Low Power Electronics and Design, 420-423. ACM, August.
Mackensen, E., Lai, M. & Wendt, T. M. (2012). Performance analysis of a Bluetooth Low Energy sensor system. 2012 IEEE 1st International Symposium on Wireless Systems (IDAACS-SWS).
Mikhaylov, K., Plevritakis, N. & Tervonen, J. (2013). Performance analysis and comparison of Bluetooth Low Energy with IEEE 802.15. 4 and SimpliciTI. Journal of Sensor and Actuator Networks, 2(3), 589-613.
Nordic (2017). Nordic nRF52832 Specification. Available from: http://infocenter.nordicsemiâ.com/pdf/nRF52832_PS_v1.4.pdf
OnWorld. (2017). Bluetooth Low Energy IoT: A Market Dynamics Report. Available from https://www.researchandmarkets.com/research/45cbbg/bluetooth_low .
OnWorld. (2018). 802.15.4 IoT Markets: Zigbee, Thread, 6LoWPAN, Wi-SUN and Others. Available from https://onworld.com/research/zigbeealliance/vip/ .
Oweis, N. E., Aracenay, C., George, W., Oweis, M., Soori, H., & Snasel, V. (2016). Internet of Things: Overview, Sources, Applications and Challenges. Proceedings of the Second International Afro-European Conference for Industrial Advancement AECIA 2015, 57-67. Springer, Cham.
Pal Amutha, K., Sethukkarasi, C. & Pitchiah, R. (2012). Smart Kitchen Cabinet for Aware Home. SMART 2012, The First International Conference on Smart Systems, Devices and Technologies, Stuttgart, Germany.
Perahia, E. & Stacey, R. (2013). Next Generation Wireless LANS: 802.11 n and 802.11 ac. Cambridge: Cambridge University Press.
Redbear. (2018). Redbear Nano v2. Available from: https://redbear.cc/product/ble/ble-nano-2.html
Shahzad, K. & Oelmann, B. (2014). A comparative study of in-sensor processing vs. raw data transmission using ZigBee, BLE and Wi-Fi for data intensive monitoring applications. 2014 11th International Symposium on Wireless Communications Systems (ISWCS).
Siekkinen, M., Hiienkari, M., Nurminen, J. K. & Nieminen, J. (2012). How low energy is bluetooth low energy? Comparative measurements with ZigBee/802.15.4. Wireless Communications and Networking Conference Workshops (WCNCW), IEEE.
Weldon, M. K. (2016). The Future X Network: a Bell Labs Perspective. CRC press.
Yang, H., Sawhney, R., Zhang, G., Marella, L. & Han, Z. (2014). Using Smart Kitchen for grocery purchase prediction. Proceedings of the 2014 Industrial and Systems Engineering Research Conference.
ZigBee Alliance. (2012). ZigBee Specification (IEEE 802.15.4). Available from: https://www.zigbee.org/download/standards-zigbee-specification/#

