Abstract
In the past two decades digital inequality has come to be understood as a complex, evolving and critical issue in Australia, as it has elsewhere. This conceptual shift has generated demand for more complex measurement tools that can capture and combine multiple and graduated indicators of digital inequality. The Australian Digital Inclusion Index (ADII), developed in 2015 and now including annual data covering the period 2014 to 2018, is a composite index that addresses this demand. This paper describes the development of the ADII, its architecture and the dataset used to populate it. It also provides an overview of the findings of the 2018 edition of the index. The 2018 index reveals that, although on aggregate digital inclusion is improving in Australia, it continues to follow distinct geographic, social and socio-economic contours. In general, rural and regional Australians, older Australians and Australians with low levels of income, employment, and education are less digitally included than their compatriots. For some of these groups the inclusion gap is widening.
Introduction
In recent years digital inclusion has emerged as a significant social challenge, and thus a critical area of investigation and policy development in Australia, as it has elsewhere. Digital technologies have become progressively more deeply embedded in work, education, government, healthcare services and other aspects of everyday experience. Indeed, digital communication is now widely seen as an essential service, comparable to basic utilities in its contribution to welfare.
Our recent work through the Australian Digital Inclusion Index (ADII) reveals that, although digital inclusion is improving in Australia, levels of digital access, affordability and abilities (the three fundamental elements of digital inclusion captured by the ADII) continue to follow distinct social and socio-economic contours (Thomas et al., 2018). Indeed, despite the overall lift in digital inclusion in Australia, the âinclusion gapâ has expanded for some groups. For instance, the gap in the level of digital inclusion between those in the lowest and highest income quintiles is greater in 2018 than it has been over any of the years since the ADII was first calculated in 2014.
In this paper we provide an overview of the changes to digital inclusion in Australia. Before we present this analysis, we briefly discuss the emergence of increasingly nuanced and complex conceptualisations of digital inequality and the consequent development of multi-dimensional indexes in a bid to quantify and track relative levels of inclusion across populations and over time. We outline the emergence of the Australian Digital Inclusion Index as one such tool, describe its architecture and the Roy Morgan Research Single Source dataset that is used to populate it.
Conceptualising and Measuring Digital Inclusion
Problematising the social impact of differential access and use of communication technologies has a history that extends beyond the emergence of the public internet (Sassi, 2005; Andreasson, 2015). But the issue gained significant traction as the World Wide Web began to achieve mass diffusion in a number of developed countries by the late 1990s (van Dijk, 2012, p. 2). The term âdigital divideâ, which entered circulation in the United States in the mid-to-late 1990s, before its broad international adoption, was the primary moniker under which digital inequality was described in these early years of the internet (Gunkel, 2003). Although use of the term varied, its framing in the public policy of the Clinton-Gore Administration ensured it came to primarily denote âa form of socioeconomic inequality demarcated by the level of access that one has to ITâ (Gunkel, 2003, p. 503). Conceptualising the divide as one centred on material access to technology informed a substantial volume of research (see literature reviews by DiMaggio et al. (2004), Dewan & Riggins (2005), van Dijk (2006) and Mubarak (2015)). Particularly important were studies conducted by the U.S. Department of Commerce National Telecommunications and Information Administration (NTIA) between 1995 and 1999. These NTIA studies measured and benchmarked the divide in terms of personal access to telephone, computer and internet connections (NTIA, 1995; NTIA, 1998; NTIA, 1999).
Reducing socio-technological differences to material access to communication technologies and applying a binary logic that divided those with and without such access would increasingly be criticised for failing to capture the complexity of the personal digital experience and the need for more targeted policy interventions to address inequality (van Dijk, 2006, p. 222; Gunkel, 2003, pp. 505-509; Strover, 2003, p. 275). One response has been to classify the digital divide into a hierarchical taxonomy of digital divide levels. Hargittai (2002) initiated this process. Arguing that to understand online inequality it was âincreasingly important to look at not only who uses the Internet, but also to distinguish varying levels of online skills among individualsâ, Hargittai labelled access as the first-level digital divide and online capabilities the second-level divide (Hargittai, 2002). A third level was later added to the taxonomy. It seeks to capture how internet use translates into offline outcomes (Kwok-Kee et al., 2011; Dewan & Riggins, 2005; Helsper & van Deursen, 2015), thus suggesting integration between online and offline experiences of advantage and disadvantage.
While the concept of the digital divide has retained its scholarly and political currency, particularly in its renovated multi-level form, there has also been moves to conceptualise inequality in new ways that more clearly emphasise its multiplicity, continuity and social constitution. DiMaggio & Hargittai (2001, p. 8) suggested using the term digital inequality as a means of moving âbeyond the digital divideâ and its binary logics. Hargittai (2003, p. 2) defined digital inequality as a ârefined understanding of the âdigital divideâ that emphasizes a spectrum of inequality across segments of the population depending on differences along several dimensions of technology access and useâ. More recently, and consistent with assets-based and people-centred logics emerging in other disciplinary domains, the term digital inclusion has emerged as a more positive and human, rather than technology-centred, term to conceptualise digital inequality and its impact in undermining the broader goal of social inclusion (Walton et al., 2013, p. 9.4; Tsatsou, 2011; Helsper, 2008; Crandall & Fisher, 2009, p. 5).
As the conceptualisation of digital inequality has become more nuanced to reveal its multifaceted and graduated nature, the demand for more complex methods for measuring the nature and extent of such inequality arose (Selwyn, 2004). In 2006, Barzilai-Nahon bemoaned that, despite the conceptual shift in discourse to digital inequality, most analyses continued to be atomic and monotopical, focusing on a single factor rather than taking a holistic and comprehensive view through âintegrative frameworks and measurementsâ (Barzilai-Nahon, 2006, p. 269). Over time, multi-factor digital inclusion analyses have become more prevalent, with increasing levels of sophistication around identifying the interaction between factors (cf. van Deursen et al., 2017). Composite indexes (Nardo et al., 2008), which are capable of systematically quantifying digital inclusion as a complex phenomenon based on a suite of specific indicators, have also been developed and refined.
Digital inclusion indexes first emerged at the global analytical level (Dewan & Riggins, 2005). These global level indexes focus on quantifying digital inclusion at the national level to enable international comparison (Barzilai-Nahon, 2006, p. 271). The International TelecommunÂications Union (ITU) has been a pivotal player in the development of such indexes, beginning with the Digital Access Index in 2003 (ITU, 2009, Chapter 3; Bruno et al., 2011). Its latest index, the ICT Development Index, combines data on communication service subscriptions, home computer and internet access, internet usage, and skills proxy indicators (mean years of schooling, gross secondary enrolment, and gross tertiary enrolment) to generate three sub-indexes: access, use and skills. Since 2017, The Economist Intelligence Unit (on behalf of Facebook) has collated an annual Inclusive Internet Index. The index combines personal, institutional and infrastructural indicators divided into four domains (availability, affordability, relevance and readiness) to generate a holistic view of a countryâs level of internet inclusion (EIU, 2019, p. 13).
Over time, there has been increasing interest in developing indexes that seek to compose a comprehensive picture of digital inclusion for individuals that would enable demographic and intra-national geographic analysis. One of the first such indexes was developed in South Korea, where the government had been quick to engage with the issue of digital inclusion, even passing a Digital Divide Act in 2001 (Park & Jae Kim, 2014, p. 75). South Koreaâs Digital Divide Index (DDI) was first compiled in 2004. It incorporates indicators across âthree dimensions of digital divide â access, skills and utilisationâ and measures relative digital inequality between a number of socio-economically disadvantaged groups and the general population at a single point and over time (Park & Jae Kim, 2014, p. 76). Initially, four groups were identified: âthe disabled, the elderly, low-income persons and agriculture/fishery workersâ (Park & Jae Kim, 2014, p. 76). From 2011, new groups were added, including âNorth Korean refugees and transnational marriage migrantsâ (Park & Jae Kim, 2014, p. 76). A more recent development is the Lloyds Bank UK Consumer Digital Index. It has been compiled annually since 2016. Reflecting an increasing use of data analytics to make best use of latent information, this index aggregates data from multiple surveys and bank transaction records to generate financial and digital capability scores (Lloyds Bank, 2018). This data has been further used as an input into the Digital Exclusion Heatmap created by Tech Partnership, a UK digital skills development alliance (The Tech Partnership, 2017). The Digital Exclusion Heatmap is a predictive geographic digital inclusion index which combines data on digital access, infrastructure and a range of social metrics.
The ADII: History, Dataset and Architecture
In 2015, Telstra, Australiaâs largest telecommunications company, initiated a project with Swinburne University to develop an Australian digital inclusion index. Substantial consultation with commercial, community and government stakeholders was undertaken, centring on the Australian Digital Inclusion Index Discussion Paper (SISR et al., 2015). The consultation confirmed the desirability of a complex digital inclusion measure that integrated indicators across three dimensions: access, affordability and digital capabilities. The consultation also highlighted the need for the index to be populated with data that would enable relatively refined geographic and socio-economic analysis and that had the potential to support benchmarking the progress of digital inclusion initiatives. The research team identified a range of government, community and market research datasets that contained indicators which might be integrated using statistical modelling techniques. These included those compiled by/for the Australian Bureau of Statistics, the Australian Communications and Media Authority, Roy Morgan Research and The Smith Family (ABS, 2011; ABS, 2014; ACMA, 2015; Roy Morgan Research Ltd, 2015; The Smith Family, 2013). During this scoping process, the team determined that the Roy Morgan Single Source survey included a sufficient range of indictors to populate an index, enabling the generation of a digital inclusion score for each survey respondent and thereby obviating the need for any form of multi-source statistical overlay. The Australian Digital Inclusion Index (ADII) that emerged from the consultation process is exclusively populated with Roy Morgan Single Source data.
The Single Source, the worldâs largest ongoing single source survey, is compiled by Roy Morgan Research (Roy Morgan Research Ltd, 2018). It is administered every weekend as a face-to-face interview combined with a supplementary leave-behind self-completion booklet to a representative sample of households spread over more than 500 sampling areas across Australia (Roy Morgan Research Ltd, 2017). Over the course of 12 months, the survey yields around 15,000 returns suitable for use in the ADII. The large sample size and geographic coverage often permits geographic and demographic reporting with low margins of error at a high level of confidence (95%+). As an ongoing dataset, it has been possible to generate annual index results for five years to date (2014-2018). The annual datasets represent a 12-month sample to March of that year (e.g. 2014 contains data collected between April 2013 and March 2014). Although the dataset is robust, as with any social research instrument it does have limitations. For instance, the survey is administered in English, which may restrict coverage of those with limited English and/or literacy. Around 800,000 people whose second language is English do not speak it well or at all, while 1.5 million English speakers have low levels of literacy, which may cause issues in relation to the leave-behind booklet (ABS, 2016; ABS, 2013).
Overall, data from more than 100 questions in the Single Source relating to internet products, services, activities, attitudes and income are used to generate an individualâs digital inclusion index score (ADII score). The computation of the ADII score is based on the equally weighted aggregation of three sub-indexes conforming to the three explanatory dimensions identified in the consultation phase: Access, Affordability and Digital Ability. These sub-indexes are also the result of hierarchical component and variable aggregation, an example of which is displayed in Figure 1.
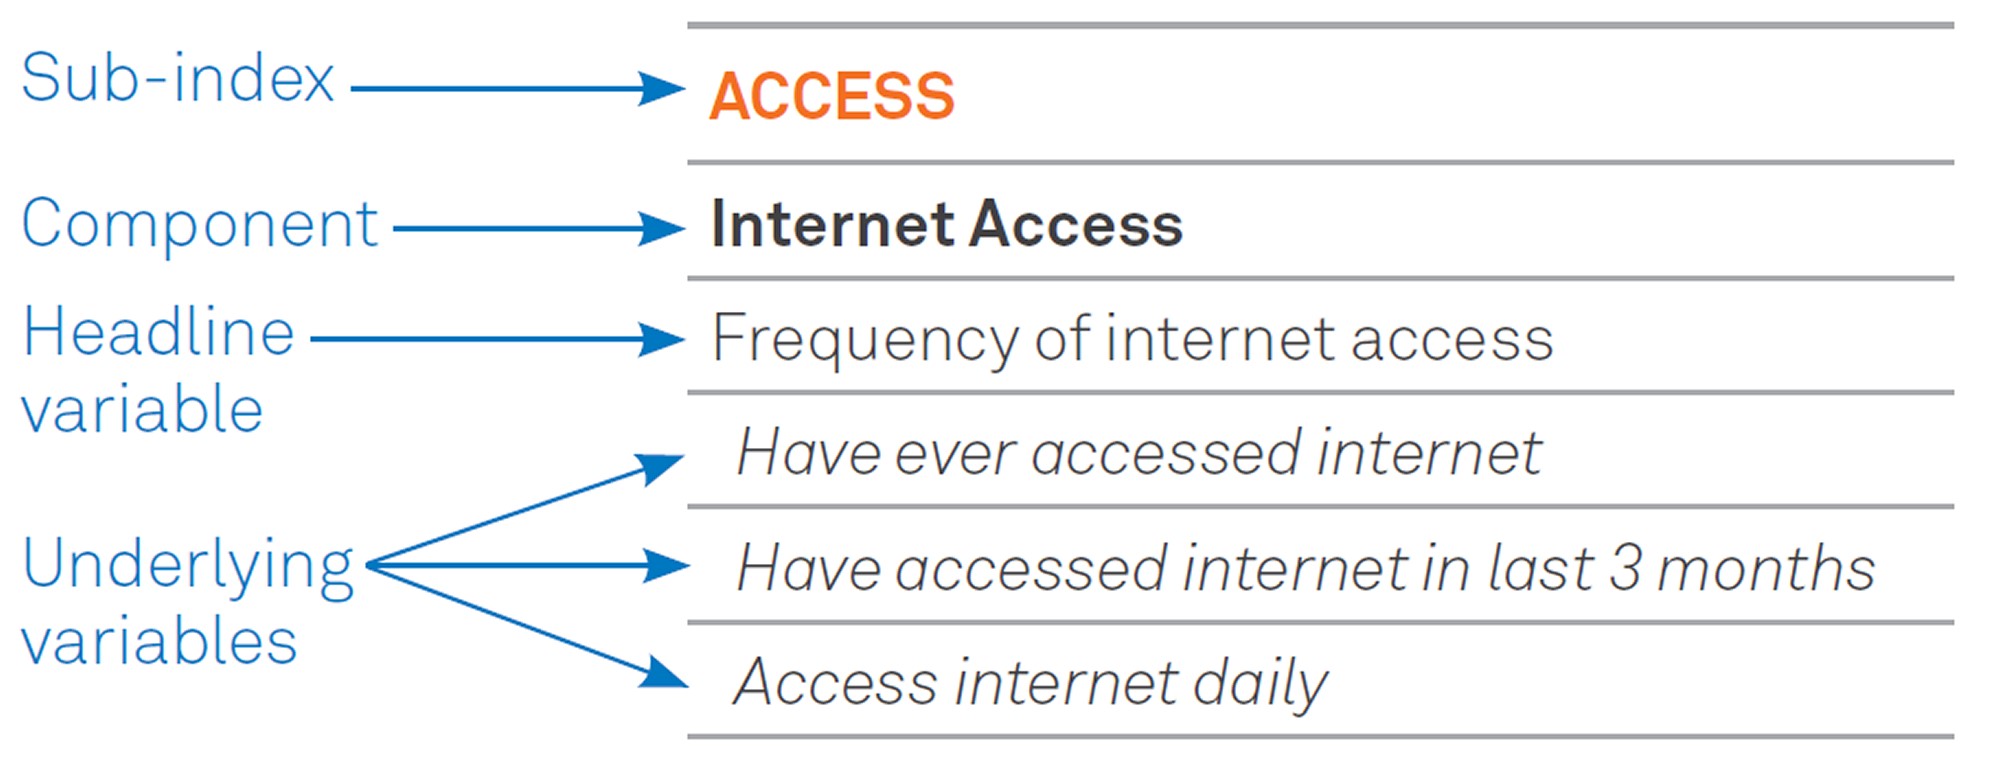
Figure 1. Example of ADII sub-index structure
Each of the sub-indexes is made up of a number of components, which have themselves been calculated as the simple average of numerous headline variables. Headline variables are thematic composites of underlying variables (generally individual survey questions) and are usually calculated as simple averages. In the example provided as Figure 1, the underlying variable âHave ever accessed internetâ feeds into the headline variable âFrequency of internet accessâ, itself the average of this and two other underlying variables. This headline variable then contributes in equal weight to two other headline variables (Places of internet access, and Number of internet products) to the Internet Access component. This is clear from Table 1 which provides a basic overview of the structure of the ADII. A more refined outline of the entire ADII architecture is provided as an appendix to the annual ADII reports (cf. Thomas et al., 2018, pp. 46-47).
Respondents receive a score between 0 and 100 for each variable, with the upper limit indicating a higher level of inclusion. Where the variable is binary, the score received is 0 or 100. For example (from Figure 1), respondents who have not ever accessed the internet receive 0, those that have score 100. For non-binary variables (e.g. relative expenditure, which equates to percentage of household income spent on internet access) responses are ranged and recoded into a figure between 0 and 100. In this scoring system, a âperfectly includedâ respondent will receive an overall ADII score of 100. Given the simple averaging architecture of the index, 100 is the âperfectly-includedâ benchmark for all variables, headline variables, components and sub-indexes. Examination of the spread of results across the dataset have enabled us to generate âinclusionâ bands for the index and three sub-indexes that provide a handy comparative frame (see Table 2).
Table 1. ADII sub-index structure (components, headline variables and select underlying variables)
|
Access |
|||
|
Internet Access |
Internet Technology |
Internet Data Allowance |
|
|
Frequency of internet access: - Have ever accessed internet - Have accessed internet in last 3 months - Access internet daily Places of internet access: - Have accessed internet from home - Have accessed internet away from home Number of internet products: - One or more internet products - Two or more internet products |
Computer technology: - Have personal computer or tablet computer in household Mobile internet technology: - Own or use mobile phone - Have mobile internet Fixed internet technology: - Have fixed broadband - Have cable or NBN fixed Broadband |
Mobile internet data: - Have mobile internet - Have mobile internet data allowance over 1GB - Mobile internet data allowance relative to benchmark Fixed internet data: - Have fixed broadband - Have Fixed Broadband data allowance over 10GB - Fixed Broadband data allowance relative to benchmark |
|
|
Affordability |
|||
|
Relative Expenditure |
Value of Expenditure |
||
|
Share of household income spent on internet access relative to benchmark |
Total internet data allowance per dollar of expenditure on internet access, relative to benchmark |
||
|
Digital Ability |
|||
|
Attitudes |
Basic Skills |
Activities |
|
|
Computers and technology give me more control over my life I am interested in being able to access the Internet wherever I am I go out of my way to learn everything I can about new technology I find technology is changing so fast, itâs difficult to keep up with it (negative) I keep my computer up to date with security software |
General internet skills Mobile phone skills Internet banking skills Internet shopping skills Internet community skills Internet information skills |
Streamed, played, or downloaded content online AV communication via the internet Internet transaction or payment Purchased or sold a product online Created or managed a site or blog Searched for advanced information |
|
Source: Thomas et al., 2018.
Notes for Table 1: Relative Expenditure Benchmark: A percentage of household income expended on internet connections was derived for all respondents with internet connections in the 2016 dataset. Respondents were ranked using this percentage and divided into five equal groups to determine benchmark ranges. Respondents receive an index score based on the range they fall within as follows: 0.01â73% (100); 0.74â1.13% (75); 1.14â1.65% (50); 1.66â2.75% (25); 2.75% or more (0). Changes in affordability over time are measured against the base year of 2016. Value of Expenditure Benchmark: A data allowance per dollar of expenditure was derived for all respondents with internet connections in the 2016 (April 2015-March 2016) dataset. Respondents were ranked using this value and divided into five equal groups to determine benchmark ranges. Respondents receive an index score based on the range they fall within as follows: 0.01â0.1 GB/$ (0); 0.11â0.7 GB/$ (25); 0.71â2.6 GB/$ (50); 2.61â6.8 GB/$ (75); 6.81 GB/$ or more (100). Changes in affordability over time are measured against the base year of 2016.
Table 2. ADII and sub-index comparative ranges
|
|
Low |
Medium |
High |
|
ACCESS |
<60 |
65-75 |
>80 |
|
AFFORDABILITY |
<45 |
50-60 |
>65 |
|
DIGITAL ABILITY |
<40 |
45-55 |
>60 |
|
ADII SCORE |
<50 |
55-65 |
>70 |
Source: Thomas et al., 2018.
In the next section, we present findings from the 2018 ADII dataset. We will also present some findings based on a supplementary survey developed by the ADII research team and administered in the remote Indigenous community of Ali Curung (a community of approximately 500 people located 380 km north of Alice Springs) and with some members of the deaf and hard of hearing (DHH) community. The ADII Supplementary Survey consists of specific questions from the Roy Morgan Single Source survey used to compile the index. The majority of these questions are directly transposed. Some have minor modifications to ensure they work in the online tool used to administer the survey. The tool can be used for self-completion (as it was for the DHH community) or as part of a face-to-face method (as it was in Ali Curung). In-field pilot testing, using a national representative online panel, confirms that the composition of the ADII Supplementary Survey generates comparable scores to the Single Source.
Digital Inclusion in Australia in 2018
At a national level, the ADII reveals that digital inclusion has been steadily improving in Australia since 2014 (see Table 3). In 2018, the national ADII score was 60.2, some 6.2 points higher than in 2014 (54.0). Furthermore, in the previous 12 months the national score rose 2.2 points, the largest annual improvement since the ADII data series began in 2014. There have been marked improvements in the Access and Digital Ability dimension of digital inclusion, but progress in relation to Affordability has been poor.
Access has improved steadily over the four years since 2014, rising from 63.9 in 2014 to 73.4 in 2018. All three components of the Access sub-index have improved steadily since 2014. The Internet Access component was already relatively high at 82.7 in 2014 and has made marginal annual improvements since then to hit 87.1 in 2018. The Internet Technology and Internet Data Allowance component scores both started from a lower base and have steadily improved over the four years to 2018. The Internet Technology score rose from 68.2 in 2014 to 78.7 in 2018, while the Internet Data Allowance score rose from 40.8 in 2014 to 54.4 in 2018. These improvements reflect several developments, including the proliferation of connected consumer devices, especially smart phones, and the growing demand for data as Australians spend more time â and do more things â online. It also reflects improvements to mobile and fixed network infrastructure, including the National Broadband Network (NBN).
There is emerging evidence that the rollout of NBN infrastructure is linked to improvements in the Internet Technology and Data Allowance components of digital inclusion. It is the 2018 ADII results for Tasmania where this link is currently most discernible. Tasmania was one of the initial NBN rollout locations and, by 2018, more than 95% of the state rollout was complete (NBN Co, 2017, p. 38). Between the 2017 and 2018 ADII periods, the percentage of Tasmanians with NBN connections more than doubled, from 29% to 60% and this development seems to have driven fixed broadband uptake, access to higher quality of fixed broadband connections, and larger data allowances (Thomas & Wilson, 2018).
At the national level, affordability has improved only marginally since 2014 and was in decline between 2014 and 2016 before a slight recovery since. The limited improvement in Affordability does not reflect rising costs. In fact, internet services are becoming less expensive as indicated by the Value of Expenditure component (a measure of gigabytes accessible per dollar spent). This affordability component increased from 51.6 points in 2014 to 60.9 points in 2018. However, while cost per gigabyte of accessible data continues to fall, Australians are spending more money on internet services, as demands and opportunities for digital participation increase. Expenditure on internet services has increased faster than household income, resulting in a consistent annual decline in the Relative Expenditure component (which reflects the share of household income spent on internet services). Overall, the proportion of household income devoted to internet services has risen from 1.00% in 2014 to 1.17% in 2018. Relative expenditure issues have had a very negative impact on Australians with lower incomes because they have less discretionary income to spend. As a result, many of Australiaâs more digitally excluded groups did not report any overall improvement in Affordability between 2014 and 2018. These groups include people from low income households, people with disability, people not in the labour force (NILF), and people who did not complete secondary school.
All three components of the Digital Ability sub-index have improved at the national level since 2014. The Attitudes component rose 5.1 points, Basic Skills 10.1 points, and Activities 6.9 points. However, all three have risen from a low base. The data shows that, while Australians report increasing interest in having continuous internet access, they struggle to keep up with new technologies, and relatively few users engage in more advanced activities. Furthermore, less than half of the population consider digital technologies to be empowering. Digital Ability should remain an important area for attention for policy makers, business, education, and community groups interested in improving digital inclusion.
Table 3. Australian ADII scores over time (ADII 2014-2018)
|
|
ACCESS |
AFFORDAB. |
DIGITAL ABILITY |
ADII |
||||||||
|
Internet Access |
Internet Technology |
Internet Data Allowance |
Access Score |
Relative Expenditure |
Value of Expenditure |
Affordability Score |
Attitudes |
Basic Skills |
Activities |
Dig Ability Score |
ADII Score |
|
|
2014 |
82.7 |
68.2 |
40.8 |
63.9 |
60.3 |
51.6 |
56.0 |
45.9 |
46.6 |
34.1 |
42.2 |
54.0 |
|
2015 |
83.3 |
69.1 |
41.5 |
64.6 |
58.8 |
49.9 |
54.3 |
47.3 |
49.7 |
36.2 |
44.4 |
54.4 |
|
2016 |
84.4 |
73.0 |
45.7 |
67.7 |
55.0 |
52.9 |
54.0 |
49.2 |
51.7 |
37.2 |
46.0 |
55.9 |
|
2017 |
85.4 |
75.7 |
51.2 |
70.8 |
54.9 |
56.9 |
55.9 |
50.1 |
53.3 |
38.4 |
47.3 |
58.0 |
|
2018 |
87.1 |
78.7 |
54.4 |
73.4 |
54.3 |
60.9 |
57.6 |
51.0 |
56.7 |
41.0 |
49.5 |
60.2 |
Source: Thomas et al., 2018
While the ADII reveals a steady improvement in digital inclusion at the national level, it also shows that deep divisions exist between different geographic areas and demographic, economic and social groups; and, in some cases, these have increased over time (see Table 4 and Table 5). In general, rural, regional and remote Australians, older Australians and Australians with low levels of income, employment and education are significantly less digitally included.
Geography plays a critical role in digital inclusion in Australia. The ADII reveals significant differences between rural and urban areas. This âCapitalâCountry gapâ is evident across all three sub-indexes â Access, Affordability, and Digital Ability. In 2018, digital inclusion is 8.5 points higher in capital cities (62.4) than in country areas (53.9). The overall âCapitalâCountry gapâ has narrowed slightly over the past three years, from 9.5 (2015) to 8.5 (2018), but remains at the same level as it was in 2014.
Older Australians, people aged 65 years and over, record significantly lower levels of digital inclusion than younger people. A closer look at the population within this 65+ age group also reveals a pattern of diminishing digital inclusion as age increases. The ADII score for older Australians is 46.0, some 14.2 points below the national average and 20.5 points below the highest scoring age group (those aged 25-34 years). Figure 2 indicates the increasing gap between older Australians and those in the 25-34-year-old age range over the ADII data collation period (2014-2018). A key issue faced by older Australians â as with other groups reporting relatively low incomes â is the rising proportion of income spent on network access. As a result, digital communication affordability declined for older Australians between 2014 and 2018.
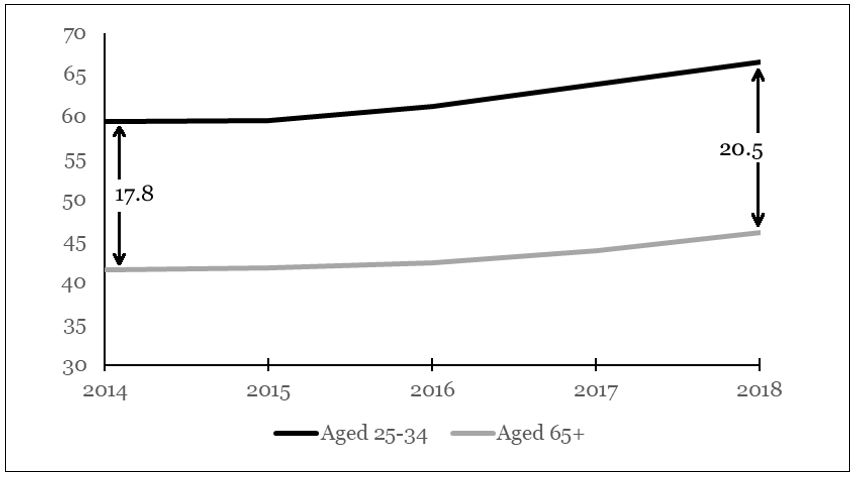
Figure 2. The age gap in digital inclusion, 2014-2018
Source: Thomas et al., 2018
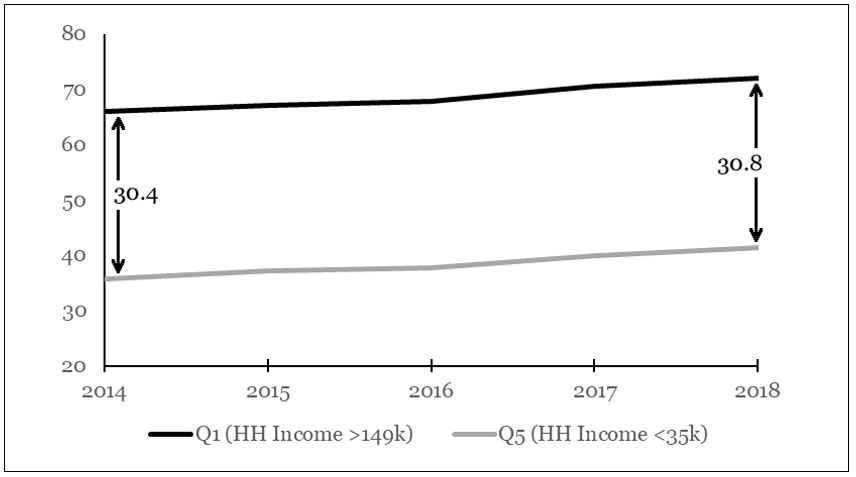
Figure 3. The income gap in digital inclusion, 2014-2018
Source: Thomas et al., 2018
The ADII illustrates a clear digital divide between richer and poorer Australians. In 2018, individuals in households with an annual income of less than $35,000 (Q5) recorded an ADII score of 41.3. This is 30.8 points lower than those living in households with an income over $150,000 (Q1) and 18.9 points below the national average score. As might be expected, it is in the area of Affordability where the digital divide between low and high-income households is greatest. People in the lowest income bracket spent approximately 3.6% of their income on network access, which translated into a Relative Expenditure score of 12.0. This is in sharp contrast to those in the highest household income bracket, who spent less than 1% of household income on network access for a Relative Expenditure score of 86.0. As Figure 3 shows, the overall digital inclusion gap between people in low and high income households has also widened since 2014. In the four years since 2014, those with the highest household income (Q1) recorded the largest ADII gain (6.0 points) of all income quintiles. In contrast, those in the lowest income bracket (Q5) recorded a slightly smaller increase of 5.6 points.
There is also a clear âemployment gapâ in digital inclusion. In 2018, the ADII score for people not in the labour force is 52.0 (8.2 points below the national average), while those who are employed have an ADII score of 65.0 (4.8 above the national average). The digital inclusion gap between those not in the labour force and employed groups has also widened since 2014, largely because of differences in the Affordability sub-index score.
The âeducation gapâ also remains significant. People who did not complete secondary school scored 47.4 (12.8 points below the national average). Those with a secondary education scored 58.3 (1.9 points below the national average), while tertiary-educated people scored 65.0 (4.8 points above the national average).
Some particular groups identified through the ADII as having distinct digital inclusion patterns are Indigenous Australians, Australians with disability, single parents and the mobile only (those with a mobile phone or mobile broadband device with a data allowance but no fixed connection). (See Table 4 and Table 5.)
Indigenous Australians living in urban and regional areas record low levels of digital inclusion. The ADII score for this population group in 2018 is 54.4âsome 5.8 points below the national average. Indigenous Australians record scores below the national average on each of the three sub-indexes. The largest gap is in Affordability, where the score for Indigenous Australians (49.7) is 7.9 points below the national average (57.6). The prevalence of mobile-only connectivity amongst Indigenous Australians, which carries higher costs per gigabyte than fixed connections, contributes to this Affordability result. Results from the ADII Supplementary Survey conducted in the remote Indigenous community of Ali Curung suggest that remoteness further diminishes digital inclusion for Indigenous Australians, particularly with regards to Access and Affordability. The digital inclusion score for the Ali Curung community (42.9) is 17.3 points lower than the Australian average (60.2) and 11.5 points lower than that recorded by Indigenous Australians in urban and regional areas.
Australians with disability (defined in the ADII as those receiving either the disability support pension or disability pension) report low levels of digital inclusion. In 2018, the ADII score for this group was 49.2 (11.0 points below the national average). Between 2014 and 2017, the gap between people with disability and the national average narrowed, largely due to gains by this group in Access and Digital Ability. However, the gap in Affordability expanded in this period. As a consequence of a lack of improvement in Affordability and Digital Ability over 2017-2018, the overall digital inclusion gap between people with disability and other Australians has widened again. These results represent outcomes for a distinct subset of the wider community of Australians with disability.
Table 4. ADII and sub-index comparative ranges
|
2018 |
ACCESS |
AFFORDAB. |
DIGITAL ABILITY |
ADII |
||||||||
|
Internet Access |
Internet Technology |
Internet Data Allowance |
Access Score |
Relative Expenditure |
Value of Expenditure |
Affordability Score |
Attitudes |
Basic Skills |
Activities |
Dig Ability Score |
ADII Score |
|
|
Australia |
87.1 |
78.7 |
54.4 |
73.4 |
54.3 |
60.9 |
57.6 |
51.0 |
56.7 |
41.0 |
49.5 |
60.2 |
|
Capital Cities |
88.8 |
79.9 |
56.5 |
75.1 |
56.8 |
63.3 |
60.0 |
53.1 |
59.3 |
43.8 |
52.1 |
62.4 |
|
Rural |
82.5 |
74.8 |
47.9 |
68.4 |
47.2 |
53.5 |
50.4 |
45.3 |
49.6 |
33.6 |
42.9 |
53.9 |
|
Aged 14-24 |
91.7 |
80.6 |
57.2 |
76.5 |
60.8 |
63.9 |
62.4 |
64.3 |
56.3 |
43.5 |
54.7 |
64.5 |
|
Aged 25-34 |
92.3 |
83.4 |
65.7 |
80.5 |
52.6 |
64.3 |
58.4 |
60.2 |
68.5 |
52.8 |
60.5 |
66.5 |
|
Aged 35-49 |
93.0 |
83.0 |
62.2 |
79.4 |
56.9 |
63.7 |
60.3 |
53.3 |
67.2 |
48.7 |
56.4 |
65.4 |
|
Aged 50-64 |
86.1 |
77.9 |
50.8 |
71.6 |
55.3 |
59.9 |
57.6 |
44.3 |
54.5 |
36.4 |
45.1 |
58.1 |
|
Aged 65+ |
72.4 |
68.2 |
36.1 |
58.9 |
44.2 |
51.1 |
47.7 |
34.3 |
36.2 |
23.9 |
31.5 |
46.0 |
|
Household Inc >149k (Q1) |
94.7 |
84.6 |
63.9 |
81.0 |
86.0 |
64.6 |
75.3 |
58.2 |
69.8 |
51.5 |
59.8 |
72.1 |
|
Household Inc <35k (Q5) |
72.0 |
66.2 |
38.8 |
59.0 |
12.0 |
50.0 |
31.0 |
36.6 |
38.1 |
26.7 |
33.8 |
41.3 |
|
Employed |
92.2 |
82.6 |
60.8 |
78.5 |
58.6 |
62.9 |
60.8 |
55.3 |
64.9 |
47.1 |
55.8 |
65.0 |
|
Unemployed |
88.1 |
79.0 |
56.6 |
74.6 |
48.3 |
61.7 |
55.0 |
56.7 |
57.3 |
45.7 |
53.2 |
60.9 |
|
Not in Labour Force |
78.9 |
72.3 |
43.5 |
64.9 |
47.7 |
57.0 |
52.3 |
43.1 |
43.3 |
30.4 |
38.9 |
52.0 |
|
Below Secondary Ed. |
73.4 |
68.3 |
40.7 |
60.8 |
46.4 |
51.7 |
49.0 |
34.7 |
37.5 |
24.6 |
32.2 |
47.4 |
|
Completed Secondary Ed. |
86.9 |
78.6 |
54.4 |
73.3 |
50.0 |
60.2 |
55.1 |
48.1 |
54.8 |
36.7 |
46.5 |
58.3 |
|
Completed Tertiary Ed. |
91.6 |
82.5 |
59.3 |
77.8 |
57.7 |
63.8 |
60.8 |
54.2 |
66.1 |
49.0 |
56.4 |
65.0 |
|
Disability |
75.1 |
70.9 |
47.8 |
64.6 |
38.6 |
53.2 |
45.9 |
42.6 |
40.0 |
28.8 |
37.1 |
49.2 |
|
Indigenous Australians |
82.4 |
73.5 |
49.6 |
68.5 |
48.1 |
51.3 |
49.7 |
53.4 |
47.2 |
34.3 |
45.0 |
54.4 |
|
Mobile Only |
74.8 |
60.0 |
29.7 |
54.8 |
55.3 |
10.7 |
33.0 |
43.2 |
46.1 |
31.5 |
40.3 |
42.7 |
|
Two Parent Families |
92.6 |
83.8 |
63.4 |
79.9 |
59.7 |
66.3 |
63.0 |
53.6 |
67.1 |
49.0 |
56.6 |
66.5 |
|
Single Parent Families |
89.2 |
79.2 |
58.3 |
75.5 |
32.2 |
58.4 |
45.3 |
45.9 |
58.1 |
41.8 |
48.6 |
56.5 |
|
DHH Survey Resp. (n: 115) |
97.4 |
89.9 |
83.6 |
90.3 |
32.2 |
68.9 |
50.5 |
77.6 |
89.8 |
80.4 |
82.6 |
74.5 |
|
Ali Curung Resp. (n: 112) |
64.3 |
40.5 |
37.2 |
47.3 |
39.6 |
12.1 |
25.8 |
47.7 |
64.5 |
44.8 |
52.3 |
42.9 |
Source: Thomas et al., 2018
Notes for Table 4 and Table 5: Single Parent Families is based on survey responses from parents living in a single-parent household structure with children aged under 18 years; Two-Parent Families is based on survey responses from parents living in a two-parent household structure with children aged under 18 years; Household Income categories based on division of population into five equal quintile bands; Disability: Respondents receiving the disability support pension or disability pension; Mobile only: respondents with a mobile phone or mobile broadband device with a data allowance, but no fixed connection.
Table 5. ADII and sub-index comparative ranges
|
Change 2014 - 2018 |
ACCESS |
AFFORDAB. |
DIGITAL ABILITY |
ADII |
||||||||
|
Internet Access |
Internet Technology |
Internet Data Allowance |
Access Score |
Relative Expenditure |
Value of Expenditure |
Affordability Score |
Attitudes |
Basic Skills |
Activities |
Dig Ability Score |
ADII Score |
|
|
Australia |
+4.4 |
+10.5 |
+13.6 |
+9.5 |
-6.0 |
+9.3 |
+1.6 |
+5.1 |
+10.1 |
+6.9 |
+7.3 |
+6.2 |
|
Capital Cities |
+4.0 |
+9.0 |
+12.4 |
+8.5 |
-4.9 |
+7.4 |
+1.2 |
+5.1 |
+10.6 |
+7.7 |
+7.8 |
+5.9 |
|
Rural |
+5.0 |
+12.3 |
+14.4 |
+10.6 |
-9.1 |
+10.6 |
+0.8 |
+4.8 |
+8.9 |
+5.1 |
+6.3 |
+5.9 |
|
Aged 14-24 |
+1.9 |
+8.2 |
+13.9 |
+8.0 |
-1.7 |
+11.6 |
+5.0 |
+2.1 |
+7.4 |
+5.8 |
+5.1 |
+6.0 |
|
Aged 25-34 |
+1.7 |
+9.4 |
+16.6 |
+9.3 |
-4.2 |
+17.0 |
+6.4 |
+3.9 |
+6.7 |
+6.4 |
+5.7 |
+7.2 |
|
Aged 35-49 |
+3.0 |
+8.8 |
+14.1 |
+8.6 |
-3.4 |
+12.7 |
+4.7 |
+6.7 |
+10.5 |
+8.9 |
+8.7 |
+7.4 |
|
Aged 50-64 |
+5.3 |
+11.5 |
+13.2 |
+10.0 |
-8.7 |
+7.8 |
-0.5 |
+5.5 |
+13.2 |
+7.1 |
+8.7 |
+6.1 |
|
Aged 65+ |
+12.6 |
+15.8 |
+12.0 |
+13.5 |
-12.1 |
-6.7 |
-9.4 |
+6.5 |
+14.4 |
+7.5 |
+9.5 |
+4.5 |
|
Household Inc >149k (Q1) |
+1.4 |
+7.1 |
+11.6 |
+6.7 |
-0.7 |
+11.9 |
+5.6 |
+2.4 |
+6.7 |
+7.4 |
+5.5 |
+6.0 |
|
Household Inc <35k (Q5) |
+9.1 |
+12.6 |
+13.0 |
+11.6 |
-6.0 |
+1.9 |
-2.1 |
+4.4 |
+11.1 |
+6.5 |
+7.3 |
+5.6 |
|
Employed |
+1.8 |
+8.9 |
+13.4 |
+8.0 |
-4.7 |
+12.0 |
+3.7 |
+4.5 |
+8.8 |
+6.8 |
+6.7 |
+6.1 |
|
Unemployed |
+5.8 |
+11.2 |
+18.7 |
+11.9 |
-3.0 |
+14.3 |
+5.7 |
+4.5 |
+11.4 |
+7.6 |
+7.8 |
+8.4 |
|
Not in Labour Force |
+8.7 |
+12.9 |
+12.7 |
+11.5 |
-8.4 |
+2.9 |
-2.8 |
+6.4 |
+12.1 |
+7.1 |
+8.5 |
+5.7 |
|
Below Secondary Ed. |
+8.6 |
+12.1 |
+12.7 |
+11.2 |
-7.1 |
+3.3 |
-2.0 |
+4.9 |
+10.6 |
+7.1 |
+7.5 |
+5.6 |
|
Completed Secondary Ed. |
+5.0 |
+10.9 |
+14.7 |
+10.2 |
-6.7 |
+10.1 |
+1.7 |
+5.9 |
+11.1 |
+5.4 |
+7.4 |
+6.5 |
|
Completed Tertiary Ed. |
+1.6 |
+8.9 |
+11.9 |
+7.5 |
-7.2 |
+11.5 |
+2.2 |
+3.0 |
+8.0 |
+6.2 |
+5.7 |
+5.1 |
|
Disability |
+6.7 |
+11.8 |
+17.1 |
+11.8 |
-5.7 |
+2.9 |
-1.4 |
+8.1 |
+11.2 |
+6.9 |
+8.7 |
+6.4 |
|
Indigenous Australians |
+6.9 |
+11.9 |
+17.7 |
+12.2 |
-7.3 |
+15.1 |
+3.9 |
+11.2 |
+11.3 |
+11.2 |
+11.3 |
+9.1 |
|
Mobile Only |
-9.6 |
-3.8 |
+2.2 |
-3.8 |
-5.7 |
+2.0 |
-1.8 |
-0.8 |
-0.3 |
-0.8 |
-0.6 |
-2.1 |
|
Two Parent Families |
+1.1 |
+7.9 |
+12.8 |
+7.2 |
-2.2 |
+14.4 |
+6.1 |
+4.2 |
+9.2 |
+8.8 |
+7.4 |
+6.9 |
|
Single Parent Families |
+4.6 |
+9.1 |
+16.8 |
+10.1 |
-4.5 |
+15.5 |
+5.5 |
+2.6 |
+11.0 |
+7.3 |
+7.0 |
+7.6 |
|
DHH Survey Resp. (n: 115) |
N/A |
N/A |
N/A |
N/A |
N/A |
N/A |
N/A |
N/A |
N/A |
N/A |
N/A |
N/A |
|
Ali Curung Resp. (n: 112) |
N/A |
N/A |
N/A |
N/A |
N/A |
N/A |
N/A |
N/A |
N/A |
N/A |
N/A |
N/A |
Source: Thomas et al., 2018
In 2018, the ADII research team conducted a supplementary survey of members of the deaf and hard of hearing (DHH) community. Results from this survey reveal very high levels of digital access and digital ability compared to the national average, but these are tempered by a lower level of affordability. On average, respondents spent a high proportion of their household income on internet access (captured by the relative expenditure component). The result for this component recorded by the DHH community was 32.2. Although a similar result (36.3) is posted by the ADII Disability cohort, there is a different dynamic at play here. The ADII Disability cohort rely on disability pensions, translating moderate expenditure on internet access into a poor Relative Expenditure result. By contrast, four in five DHH survey respondents were employed and it was a high internet spend (43% above average) that resulted in poor Relative Expenditure.
The socio-economic disadvantage of single parent families with dependent children is well documented (AIHW, 2017). Single parents have low rates of employment and many rely entirely on government benefits, which results in very low household income â more than 20% live below the poverty line (Wilkins, 2017). The ADII reveals this socio-economic disadvantage translates into digital disadvantage. Overall, single parent families have an ADII score of 56.5, 3.7 points lower than the national average and 10.0 points lower than two-parent families. Although their Access sub-index score is higher than the national average, single parent families are less likely to invest in fixed broadband access than other Australians (67.0% versus 72.9% national average). A greater dependence on rental housing and the higher levels of uncertainty and mobility this entails is one barrier to fixed broadband investment. A greater reliance on mobile-only access translates into lower levels of engagement in higher-bandwidth streaming and communication activities by single parent families. Instead, single parents are more likely to engage in functional online activities, such as financial transactions and government interactions. Affordability is the key barrier to greater digital inclusion for single parents. The impact of internet access on single-parent family budgets is substantial â it accounts for 2% of their household income compared to the national average of 1.17%. This results in a Relative Expenditure score of 32.2 â 22.1 points lower than the national average. With greater reliance on mobile connections, single parents, on average, get poorer value for money than other Australians â their Value of Expenditure score is 58.4 compared to the national average of 60.9.
More than four million Australians access the internet solely through a mobile connection â this means they have a mobile phone or mobile broadband device with a data allowance, but no fixed connection (Thomas et al., 2018, p. 16). In 2018, mobile-only users have an ADII score of 42.7, some 17.5 points below the national average (60.2). Being mobile-only not only diminishes access, but also impacts on the affordability and digital ability aspects of digital inclusion. Mobile-only use is clearly linked with a number of socio-economic factors, with people in the lowest household income quintile (29.6%), those with low levels of education (27.2%) and the unemployed (27.0%) more likely to be mobile-only. Single parents (28.8%) and Australians with disability (30.6) are also more likely to be mobile only, as are Indigenous Australians (34.7%) â indeed, all of the respondents with internet connections in the Ali Curung Supplementary Survey sample were mobile only. The position of mobile-only users that emerges from the ADII research of course reflects the current, somewhat transitional, state of the mobile internet and the resource-constrained consumer hardware and software that support it. We make no assumptions about the affordances of future mobile systems, and we note the appearance of 5G, fast Wi-Fi, and increasingly capable mobile apps and devices. Improved mobile networks and new, AI-enabled, voice-based interfaces are just two of the developments in this area that have the potential to enhance substantially the future capabilities for mobile-only users.
Conclusion
The ADII reveals that digital access, affordability and abilities continue to follow distinct geographic, social and socio-economic contours. In general, rural and regional Australians, older Australians and Australians with low levels of income, employment, and education are less digitally included than their compatriots. Despite the promise of better network infrastructure through the NBN, for some of these groups the inclusion gap is widening. As the internet and its associated technologies become increasingly embedded in Australiansâ economic, social and cultural lives, the risks of entrenching an increasingly unequal digital economy are also growing. Over a long period, Australian governments have supported inclusive and accessible national communications; that goal has played a significant part in the horizontal equity objective underpinning the NBN. The ADII adds to the growing body of evidence that a more systematic approach to policy beyond the improvement of network infrastructure is now necessary. The realization of an inclusive Australian internet will demand further interventions, especially in the areas of affordability and skills.
Acknowledgement
The Australian Digital Inclusion Index (ADII) is a collaborative venture between RMIT University, the Centre for Social Impact at Swinburne University, Telstra and Roy Morgan Research.
References
ABS. 2011. Census of Population and Housing 2011, Australian Bureau of Statistics, Canberra.
ABS. 2013. Programme for the International Assessment of Adult Competencies, Australia 2011-12, Cat 4228.0, Australian Bureau of Statistics, Canberra.
ABS. 2014. Household Use of Information Technology, Australia, 2012-13, Cat 8146.0, Australian Bureau of Statistics, Canberra.
ABS. 2016. Census of Population and Housing 2016: Table Builder, Australian Bureau of Statistics, Canberra.
ACMA. 2015. Communications Report 2014-15, Australian Communications and Media Authority, Melbourne.
AIHW. 2017. Australiaâs Welfare 2017, Australiaâs welfare series no. 13, Australian Institute of Health and Welfare, Canberra.
Andreasson, KJ. 2015. 'Introduction', in KJ Andreasson (ed) 2015, Digital divides: the new challenges and opportunities of e-inclusion, Boca Raton: CRC Press, pp. xxi-xxviii.
Barzilai-Nahon, K. 2006. 'Gaps and Bits: Conceptualizing Measurements for Digital Divide/s', The Information Society, vol. 22, no. 5, pp. 269-278.
Bruno, G; Esposito, E; Genovese, A; Gwebu, KL. 2011. 'A Critical Analysis of Current Indexes for Digital Divide Measurement', The Information Society, vol. 27, no. 1, pp. 16-28.
Crandall, M; Fisher, KE (eds). 2009. Digital Inclusion: Measuring the Impact of Information and Community Technology, New Jersey: Information Today Inc.
Dewan, S; Riggins, F, J. 2005. 'The Digital Divide: Current and Future Research Directions', Journal of the Association for Information Systems, vol. 6, no. 12, pp. 298-336.
DiMaggio, P; Hargittai, E. 2001. From the 'Digital Divide' to 'Digital Inequality': Studying Internet Use as Penetration Increases, Working Paper-Center for Arts and Cultural Policy Studies, New Jersey.
DiMaggio, P; Hargittai, E; Celeste, C; Shafer, S. 2004. 'From Unequal Access to Differentiated Use: A Literature Review and Agenda for Research on Digital Inequality', in KM Neckerman (ed) 2004, Social inequality, New York: Russell Sage Foundation, pp. 355-400.
EIU. 2019. The Inclusive Internet Index 2019: Executive Summary, The Economist Intelligence Unit for Facebook, London.
Gunkel, DJ. 2003. 'Second Thoughts: Toward a Critique of the Digital Divide', New Media & Society, vol. 5, no. 4, pp. 499-522.
Hargittai, E. 2002. 'Second-Level Digital Divide: Differences in People's Online Skills', First Monday, vol. 7, no. 4 (online).
Hargittai, E. 2003. 'The Digital Divide and What To Do About It', in DC Jones (ed) 2003, New economy handbook, San Diego: Academic Press, pp. 821-839.
Helsper, EJ. 2008. Digital inclusion: An analysis of social disadvantage and the information society, Department for Communities and Local Government, London.
Helsper, EJ; van Deursen, AJAM. 2015. 'The Third-Level Digital Divide: Who Benefits Most from Being Online?', in L Robinson; SR Cotton; J Schulz; TM Hale; A Williams (eds) 2015, Communication and Information Technologies Annual, Bingley: Emerald Group Publishing Limited, pp. 29-52.
ITU. 2009. Measuring the Information Society: The ICT Development Index, International Telecommunication Union, Geneva.
Kwok-Kee, W; Hock-Hai, T; Hock Chuan, C; Tan, BCY. 2011. 'Conceptualizing and Testing a Social Cognitive Model of the Digital Divide', Information Systems Research, vol. 22, no. 1, pp. 170-187.
Lloyds Bank. 2018. UK Consumer Digital Index 2018, Lloyds Bank, London.
Mubarak, F. 2015. 'Towards a renewed understanding of the complex nerves of the digital divide', Journal of Social Inclusion, vol. 6, no. 1, pp. 71-103.
Nardo, M; Saisana, M; Saltelli, A; Tarantola, S; Hoffman, A; Giovannini, E. 2008. Handbook on Constructing Composite Indicators and User Guide, OECD, Paris.
NBN Co. 2017. NBN Co Corporate Plan 2018-2021, NBN Co, Sydney.
NTIA. 1995. Falling through the net: A Survey of the "Have Nots" in Rural and Urban America., U.S. Dept of Commerce National Telecommunications and Information Administration, Washington, D.C.
NTIA. 1998. Falling through the net II: new data on the digital divide, U.S. Dept of Commerce National Telecommunications and Information Administration, Washington, D.C.
NTIA. 1999. Falling through the net: defining the digital divide, U.S. Dept of Commerce National Telecommunications and Information Administration, Washington, D.C.
Park, S; Jae Kim, G. 2014. 'Lessons from South Koreaâs Digital Divide Index', Info: The Journal of Policy, Regulation and Strategy for Telecommunications, Information and Media, vol. 16, no. 3, pp. 72-84.
Roy Morgan Research Ltd. 2015. Single Source Survey, Roy Morgan Research Ltd, Melbourne.
Roy Morgan Research Ltd. 2017. How we collect and process Single Source data in Australia, Roy Morgan Research Ltd, Melbourne.
Roy Morgan Research Ltd. 2018. How We Score Our Customer Satisfaction, Melbourne, Available: https://www.customersatisfactionawards.com/how-we-score [Accessed 26 Feb 2019].
Sassi, S. 2005. 'Cultural differentiation or social segregation? Four approaches to the digital divide', New Media & Society, vol. 7, no. 5, pp. 684-700.
Selwyn, N. 2004. 'Reconsidering Political and Popular Understandings of the Digital Divide', New Media & Society, vol. 6, no. 3, pp. 341-362.
SISR; CSI; Telstra. 2015. Australian Digital Inclusion Index Discussion Paper, Swinburne Institute for Social Research, Centre for Social Impact, Telstra Corporation Ltd, Melbourne.
Strover, S. 2003. 'Remapping the Digital Divide', The Information Society, vol. 19, no. 4, pp. 275-277.
The Smith Family. 2013. Sport, culture and the internet: Are Australian children participating?, The Smith Family, Melbourne.
The Tech Partnership. 2017. Get Digital Heatmap, The Tech Partnership, London, http://heatmap.thetechpartnership.com/.
Thomas, J; Barraket, J; Wilson, CK; Cook, K; Louie, Y; Holcombe-James, I; Ewing, S; MacDonald, T. 2018. Measuring Australiaâs Digital Divide: The Australian Digital Inclusion Index 2018, RMIT University for Telstra, Melbourne.
Thomas, J; Wilson, CK. 2018. 'Digital inclusion in Tasmania has improved in line with NBN rollout â will the other states follow? (Commentary)', The Conversation, 29 August.
Tsatsou, P. 2011. 'Digital divides revisited: what is new about divides and their research?', Media, Culture & Society, vol. 33, no. 2, pp. 317-331.
van Deursen, A; Helsper, E; Eynon, R; van Dijk, J. 2017. 'The Compoundness and Sequentiality of Digital Inequality', International Journal of Communication; vol. 11, pp. 452-473.
van Dijk, J. 2006. 'Digital divide research, achievements and shortcomings', Poetics, vol. 34, no. 4, pp. 221-235.
van Dijk, J. 2005. The Deepening Divide: Inequality in the Information Society, Thousand Oaks: SAGE Publications.
Walton, P; Kop, T; Spriggs, D; Fitzgerald, B. 2013. 'A digital inclusion: Empowering all Australians', Australian Journal of Telecommunications and the Digital Economy, vol. 1, no. 1, pp. 2-17.
Wilkins, R. 2017. The Household, Income and Labour Dynamics in Australia Survey: Selected Findings from Waves 1 to 15, Melbourne Institute of Applied Economic and Social Research, Melbourne.