Abstract
This paper explores the ways in which consumers gain information about mobile network performance and coverage, then examines the factors that impact mobile performance, and the challenges affiliated with representing results, which are highly influenced by transient events. The paper then discusses the role that mobile speed test apps and crowdsourcing initiatives can play in measuring mobile broadband performance, and provides an analysis of how the features and methodologies of eight major speed test applications compare and contrast. Lastly, the paper provides a brief review of the US Government?s Broadband Mapping Program; and some closing thoughts on lessons for Australia, and in particular how a crowdsourcing initiative could complement the recently announced $100m Mobile Coverage Programme.
Introduction
The Australian Communications and Media Authority (ACMA) recently held a forum on mobile network performance (ACMA 2013), with the objectives of: gaining a better understanding of what is at the heart of consumer complaints about mobile network performance; identifying whether these issues are being sufficiently addressed; finding out what information helps consumers to understand providers? network performance; and, identifying whether current offerings meet consumer needs.
Consumers gain information about mobile network performance and coverage from a number of sources including personal experience, carrier maps, word of mouth (including social networks) and mobile performance applications.
Arguably, the most definitive source of mobile coverage and performance information is provided directly by mobile network operators. However, an examination of information provided by Australian operators shows that consumers are faced with three different kinds of map information when looking at Telstra, Optus and Vodafone service coverage maps. Let us first review the different kinds of information that mobile operators provide with their online mobile coverage tools.
Figure 1 presents a screenshot of Telstra's mobile coverage map (Telstra 2013). In this map, we see that Telstra uses colour coding to provide typical download speed ranges ? for instance, 4G (dark blue) can range from 2 to 50 megabits per second (Mbps) downstream. That's quite a big range, but at least it is a range that consumers can relate to, perhaps not in technical detail, but it?s commonly understood that 50 Mbps is a lot faster than 2 Mbps.
Figure 1 ? Telstra Mobile Coverage Map (Feb 2014)
In the online map, Telstra provides typical download speeds ranging from a nationwide view all the way down to a street level view. However, the colour-coded speed ranges are quite large (especially with 4G connections) ? meaning that a consumer isn?t provided with information that would indicate an average download speed that would be experienced on a consistent basis. However, Telstra?s mapping portal provides additional functionality, such as the ability to distinguish between 3G / 4G coverage versus 2G GSM coverage, the ability to view expected speeds with and without the use of external antennas, and to select between voice and data coverage.
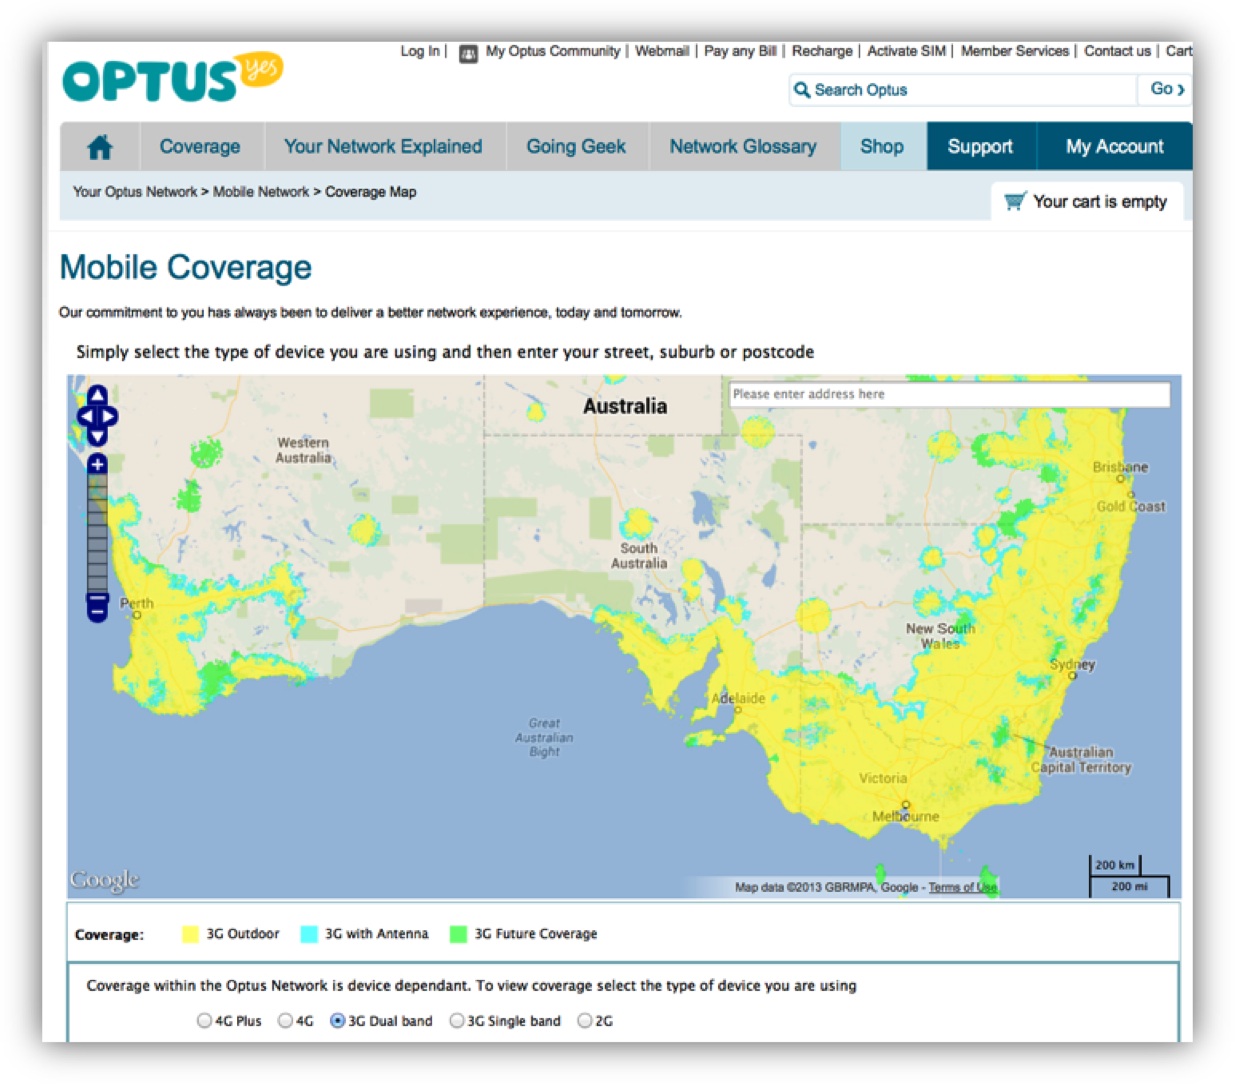
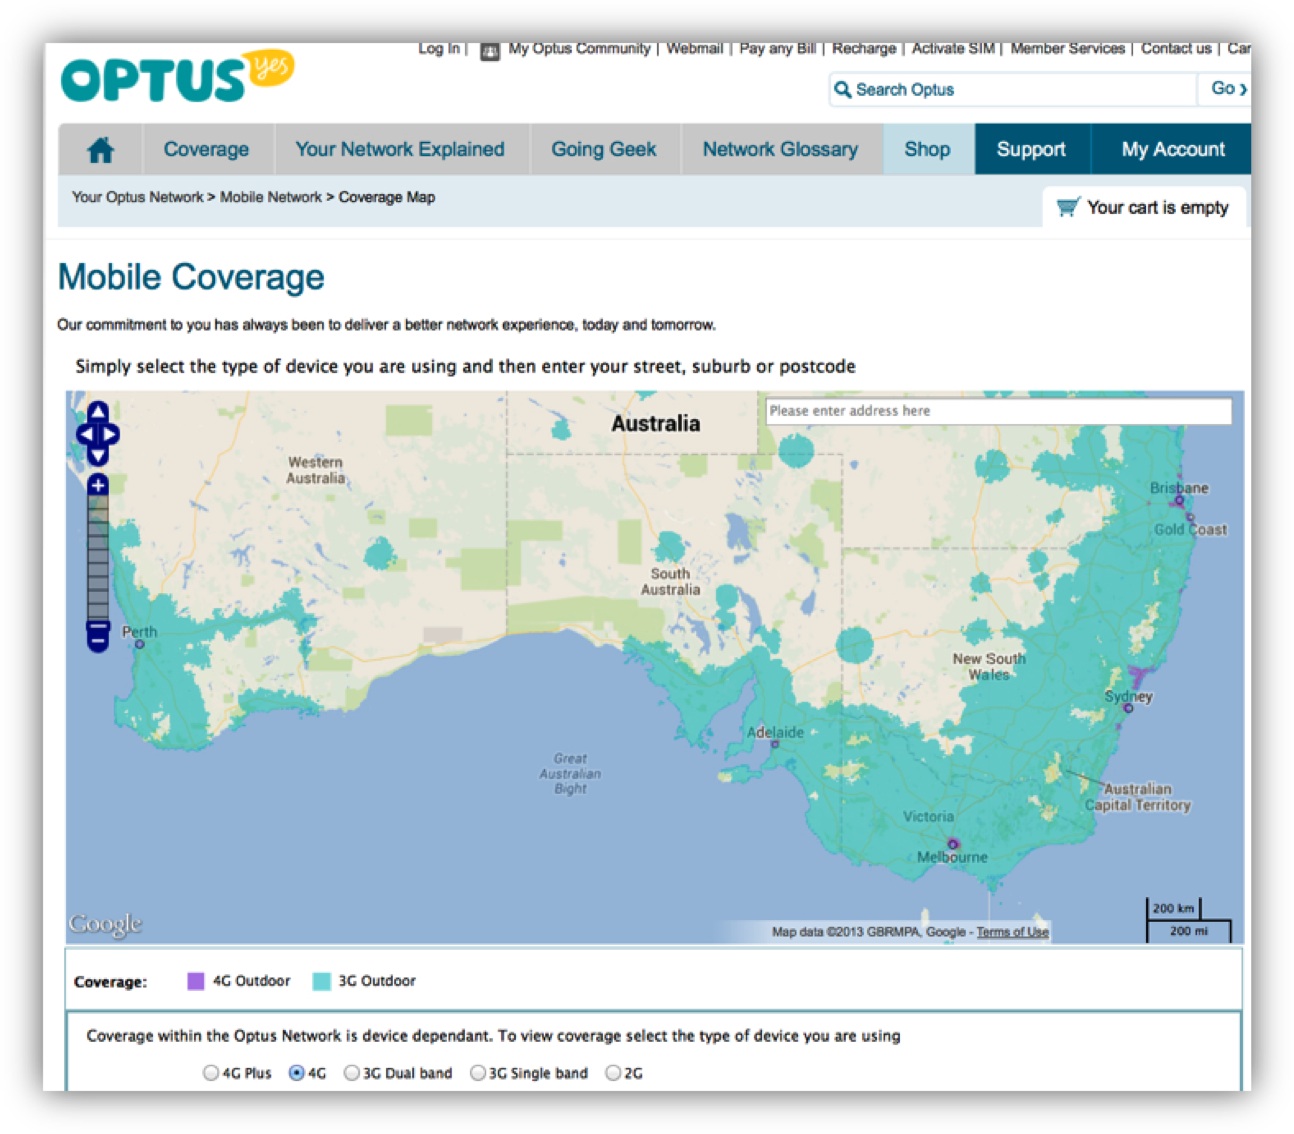
Figures 2 and 3 present screenshots of Optus? mobile coverage maps (Optus 2013). Figure 2 shows Optus? 3G dual band, whereas Figure 4 shows 4G. In contrast with Telstra, Optus maps show technology available on an outdoor and antenna basis, as well as future coverage. However, typical speeds are not shown and Optus doesn?t distinguish between voice and data coverage.
Figure 2 ? Optus 3G Dual Band Mobile Coverage Map (Nov 2013)
A typical consumer is likely to have heard the terms 3G and 4G, but they probably don't understand all the nuances, especially with respect to expected broadband speed. Furthermore, the map assumes that consumers know the radio type (4G Plus, 4G, 3G dual band, etc) used within their device, which is required to select the correct map.
Figure 3 ? Optus 3G/4G Outdoor Mobile Coverage Map (Nov 2013)
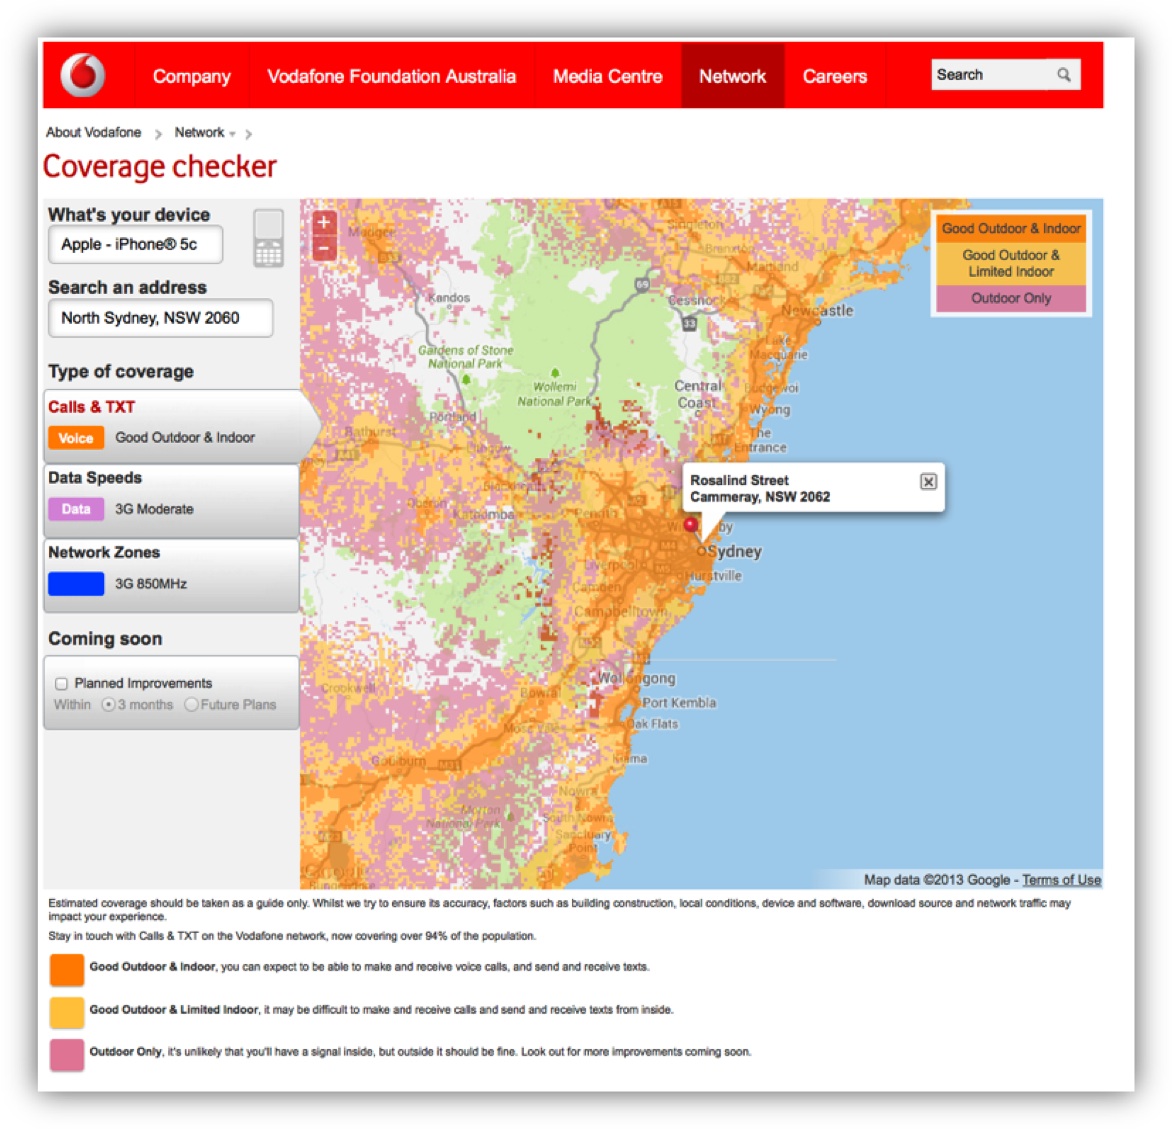
Figures 4 and 5 present screenshots of Vodafone?s mobile voice and data coverage maps (Vodafone 2013). Vodafone voice maps show colour-coded call and text (voice) availability on an indoor and outdoor basis.
Vodafone allows users to toggle between voice and data coverage ? providing results based on the specific type of device entered in a given query. This is particularly useful for examining data download speeds, as inherent device capabilities (such as being 4G capable) impact maximum expected speeds.
Figure 4 ? Vodafone Mobile Voice Coverage Map (Nov 2013)
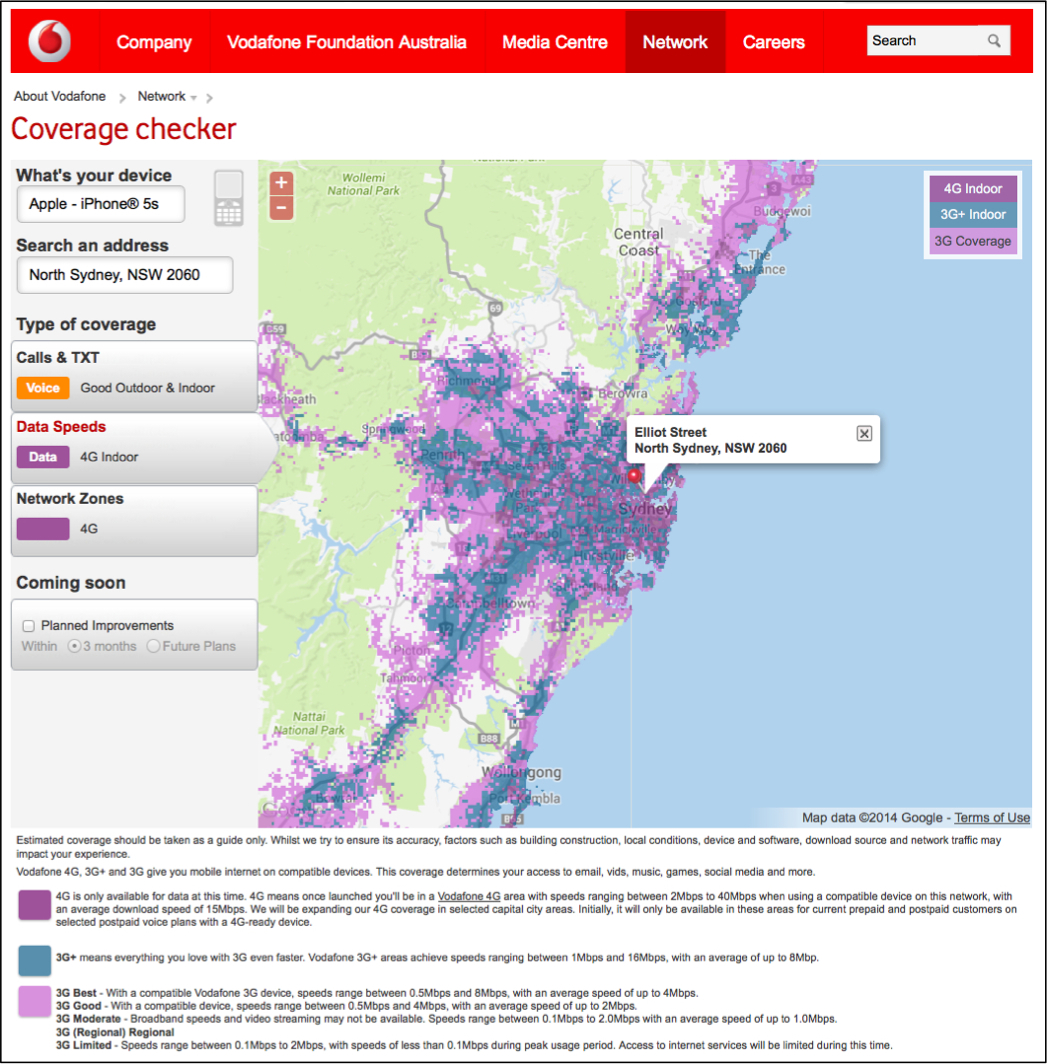
Data coverage maps provide colour-coded indications of 3G, 3G+ indoor and 4G indoor coverage, with explanatory notes for each technology?s speed range. Similar to the Telstra maps, download speed ranges are quite large: for example the range for 4G services spans from 2 to 40 Mbps. However, Vodafone also provides information about average download speeds (for 4G, an average of 15 Mbps).
Figure 5 ? Vodafone Mobile Data Coverage Map (Jan 2014)
So the consumer is faced with three different kinds of maps when they're looking at coverage and expected data download speeds for each mobile operator?s service in Australia. This makes it difficult for consumers to directly compare carrier coverage and expected download speeds, and the maps don?t provide any indications of upload speeds, which are increasingly important for many application. However, consumers can zoom down to address level, and get some good information.
Measuring Mobile Broadband Speed
When examining the issue of mobile broadband speed, there are a number of things to bear in mind.
First, signal strength can fluctuate very, very widely depending on the number of people that are using the service at a particular point in time, interference, the time of day, what kind of handset someone is using (and how sensitive the antenna is), distance from a mobile base station (or repeater), whether the device is being used indoors or outdoors, handoff between cell coverage areas, how a carrier dimensions between voice and data ? and a range of technical parameters.
Carriers and vendors routinely map expected mobile coverage based on a wide range of technical parameters including tower, and antenna information, frequency, transmit power, receiver sensitivity, and antenna gain and height. Signal propagation modelling also takes into account interferers such as terrain and vegetation features. It's quite a complex mathematical discipline and it certainly has a role in mapping, and in generating expectations of coverage, but is it the same as actual user experience? Is it precise enough to actually frame consumer expectations?
Would a better way of representing mobile broadband speed expectations be based on the actual speeds measured by end user devices? If so, one of the things to consider is how many tests are required in order to have a statistically valid sample. Is one drive test enough to inform consumer expectations? Are 10 drive tests enough? Are 100? How does that relate to a typical customer's experience? How well does the test sample reflect the variations in network conditions that occur throughout the day? Would it make more sense to enlist a large number of consumers to participate in a crowd sourcing speed test initiative?
Irrespective of the methodology used to determine typical mobile broadband speeds, how do you rank speed: what's fast, what's not fast?
In the US, the FCC has defined a range of bands for broadband downstream speeds (Western Telecommunications Alliance 2009). These bands apply equally to fixed broadband as well as mobile broadband, and they start with first-generation broadband spanning between 200 to 768 kilobits per second (Kbps), and go all the way up to what they call Broadband Tier 7, which is greater than 100 megabits per second (Mbps).
Mobile Pulse (Mobile Pulse 2014), one of the mobile performance app vendors that we?ll be discussing below has used the FCC scheme as the basis for analysing and mapping mobile speeds ? assigning A to F ratings (each with unique colour coding) to test results. In this schema, any result over 3 Mbps is consolidated into an A rating because this is roughly equivalent to a top-end 3G result. Mobile Pulse uses editable scales, so customers can define different scales to account for a mixture of 3G and 4G technologies. Table 1 provides examples of these grading scales.
Table 1 ? Classifying Mobile Broadband Downstream Speeds
|
FCC Definition of Broadband |
|
|
Broadband Tier 7 |
Greater than 100 Mbps |
|
Broadband Tier 6 |
25 Mbps to 100 Mbps |
|
Broadband Tier 5 |
10 Mbps to 25 Mbps |
|
Broadband Tier 4 |
6 Mbps to 10 Mbps |
|
Broadband Tier 3 |
3 Mbps to 6 Mbps |
|
Broadband Tier 2 |
1.5 Mbps to 3 Mbps |
|
Basic Broadband Tier 1 |
768 Kbps to 1.5 Mbps |
|
First Generation Data Tier |
200 Kbps to 768 Kbps |
|
Fails because it doesn't meet the lowest of the tiers |
Below 200 Kbps |
|
Mobile Pulse Speed Grades (3G) |
|
|
A |
Broadband Tier 3 and above (3 Mbps and above) |
|
B |
Broadband Tier 2 (1.5 Mbps to 3 Mbps) |
|
C |
Basic Broadband Tier 1 (768 Kbps to 1.5 Mbps) |
|
D |
First Generation Data Tier (200 Kbps to 768 Kbps) |
|
F |
Fails because it doesn't meet the lowest of the tiers (Below 200 Kbps) |
|
Failure |
No data connection |
|
Customer Speed Grades (3G/4G) |
|
|
A |
10 Mbps and above |
|
B |
5 Mbps to 10 Mbps |
|
C |
2 Mbps to 5 Mbps |
|
D |
1 Mbps to 2 Mbps |
|
F |
Below 1 Mbps |
|
Failure |
No data connection |
Mobile Apps
Apps that run on smartphones and tablets ? commonly referred to as mobile speed test apps ? can be used to provide information about mobile network coverage and performance to consumers, service providers, policy makers and other interested parties.
Later in this paper, we discuss the methods and tools used by US State and Local Government organisations to test mobile performance. It is useful to briefly examine the mobile apps used by these organisations, many of which are also used in Australia:
- Ookla?s Speedtest.net app (http://www.speedtest.net/), which runs on Apple, Android and Windows devices;
- RootMetrics (http://www.rootmetrics.com/), which runs on Apple and Android devices;
- OpenSignal (http://opensignal.com/), which runs on Apple and Android;
- Mobile Pulse (http://mobilepulse.com/), which runs on Apple, Android, BlackBerry and Windows;
- CalSPEED, which runs on Android devices (https://play.google.com/store/apps/details?id=gov.ca.cpuc.calspeed.android) and was custom-made for the California Public Utilities Commission (CPUC);
- SamKnows (https://www.samknows.com/), which runs on Apple and Android;
- Sensorly (http://www.sensorly.com/), which runs on Apple and Android; and
- MyMobileCoverage (http://mymobilecoverage.com/), which runs on Apple, Android, and BlackBerry.
So what are the things that one can look at in an app by way of comparing and contrasting functionality?
The first ? and arguably the most important ? is whether the testing is done on a manual or an automated basis. In the first instance, to get an app onto a device, a consumer must decide that they want to download a speed test app onto their device in the first instance; or if it's an enterprise, it may be that the enterprise decides that they want to load it on their devices. This implies that a consumer or organisation must first have an interest in measuring network performance; representing a small subset of the potential mobile subscriber population.
Furthermore, most of the apps on the market require users to conduct a manual speed test, and generally speaking people will do so when they're unhappy with network performance, or perhaps if they're playing around and curious. However, there?s an alternative, and that's automated testing. It can be done either on a continual basis, such as during drive testing, or on an automated basis at designated intervals. For instance, once an hour, once a day, twice a day, or at whatever interval an admin decides to configure.
Another consideration, particularly for consumers, is data usage monitoring. Many consumers have mobile plans with low data usage allowances. Therefore having some sort of monitoring or data usage threshold in the app is important to prevent consumer bill shock, or depletion of a consumer?s monthly data usage allowance.
Battery drain can also be an issue for consumers. Therefore, battery level monitoring is an important safety valve for consumers, especially if the app is doing automated testing. No one wants the unhappy surprise of finding that a speed test app has completely drained their battery, especially if they need to make an emergency phone call.
The next area to examine is the type of performance metrics captured. Generally, all of the apps measure upload and download speeds. Most apps measure latency. A couple will also measure delay variation or jitter, which is useful for understanding real-time video or audio performance. Packet loss is something that's very rarely captured but can be.
Signal strength measurement is interesting. We tend to think of signal strength as the barometer of whether we're going to be able to get a mobile connection and do something useful ? but how many times have you had your phone in your hand, seen five bars, and you go to Google Maps, but can't load the map; or you're trying to send an email, and you can't get something through? So signal strength, in and of itself, is not an indicator.
There?s a related issue with respect to measuring signal strength; namely that Apple, which has a very large market share, does not pass the received signal strength indicator (RSSI) in its API. So unless one jailbreaks an Apple device, an app developer can't get at it. So what you will find is that app developers measure signal strength in the Android version but are unable to do so for Apple devices.
Another differentiator in the apps is whether or not they provide maps of a particular user?s experience (history) or for all users in a given geography. Some developers provide maps inside the app, whilst others have a separate portal. And if there is a web-based portal, it may be open to the public, available only to the provider of the app, available to an enterprise or carrier on a subscription basis, or on a one-off data purchase basis.
Some of the apps allow consumers to report network problems (such as the inability to obtain a data connection) on either a manual or automatic basis. This can be done in different ways. In some cases, consumers are encouraged to push a button to tweet about a problem, or push a button to send something to a carrier (or another entity).
Last but not least are privacy considerations. First off, is there any sort of privacy documentation available within the app? Do you even know what's collected? And if you do know what's collected, is there any information that could identify you as an individual consumer?
Of the eight apps examined in this paper, seven of them run on iOS. (The only app that doesn't run on Apple devices is CalSPEED.) All run on Android; two work on BlackBerry; and two on Windows.
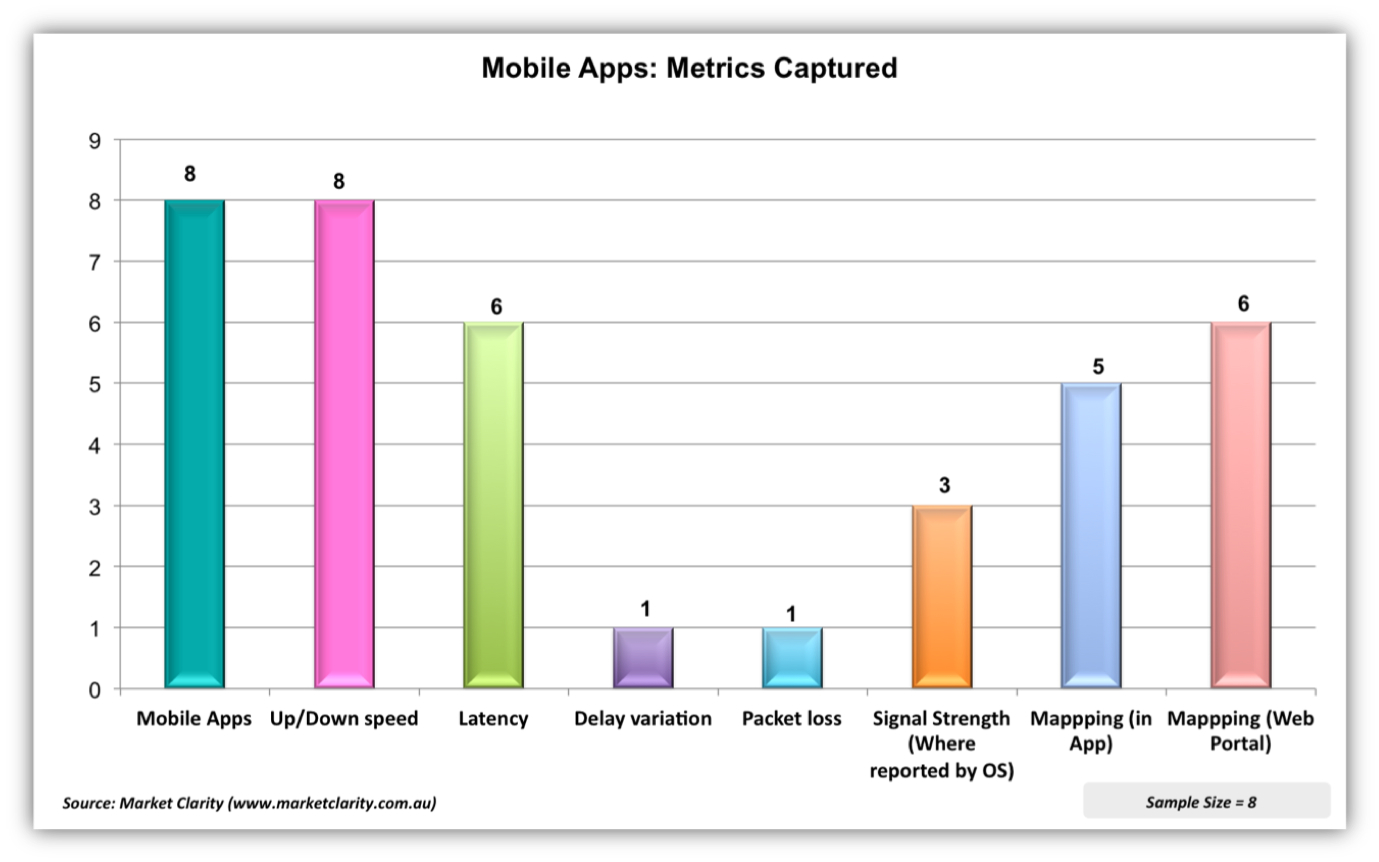
Figure 6 contains an analysis of the performance metrics captured by each of the apps examined for this paper. All of them measure upload and download speed. Six of them measure latency. Delay variation and packet loss were measured by a single app each. Three apps measure signal strength (where allowed by the OS). Five of them provide mapping within the app, and six of them offer maps in a portal, which may be public or private.
One caveat with respect to metrics: what you see in the app isn't necessarily all that's collected by the app. It's just what you, as the consumer, can see. And, this analysis relies on information as presented to a consumer using the app.
Figure 6 ? Examining the Network Performance Metrics Captured by Mobile Apps
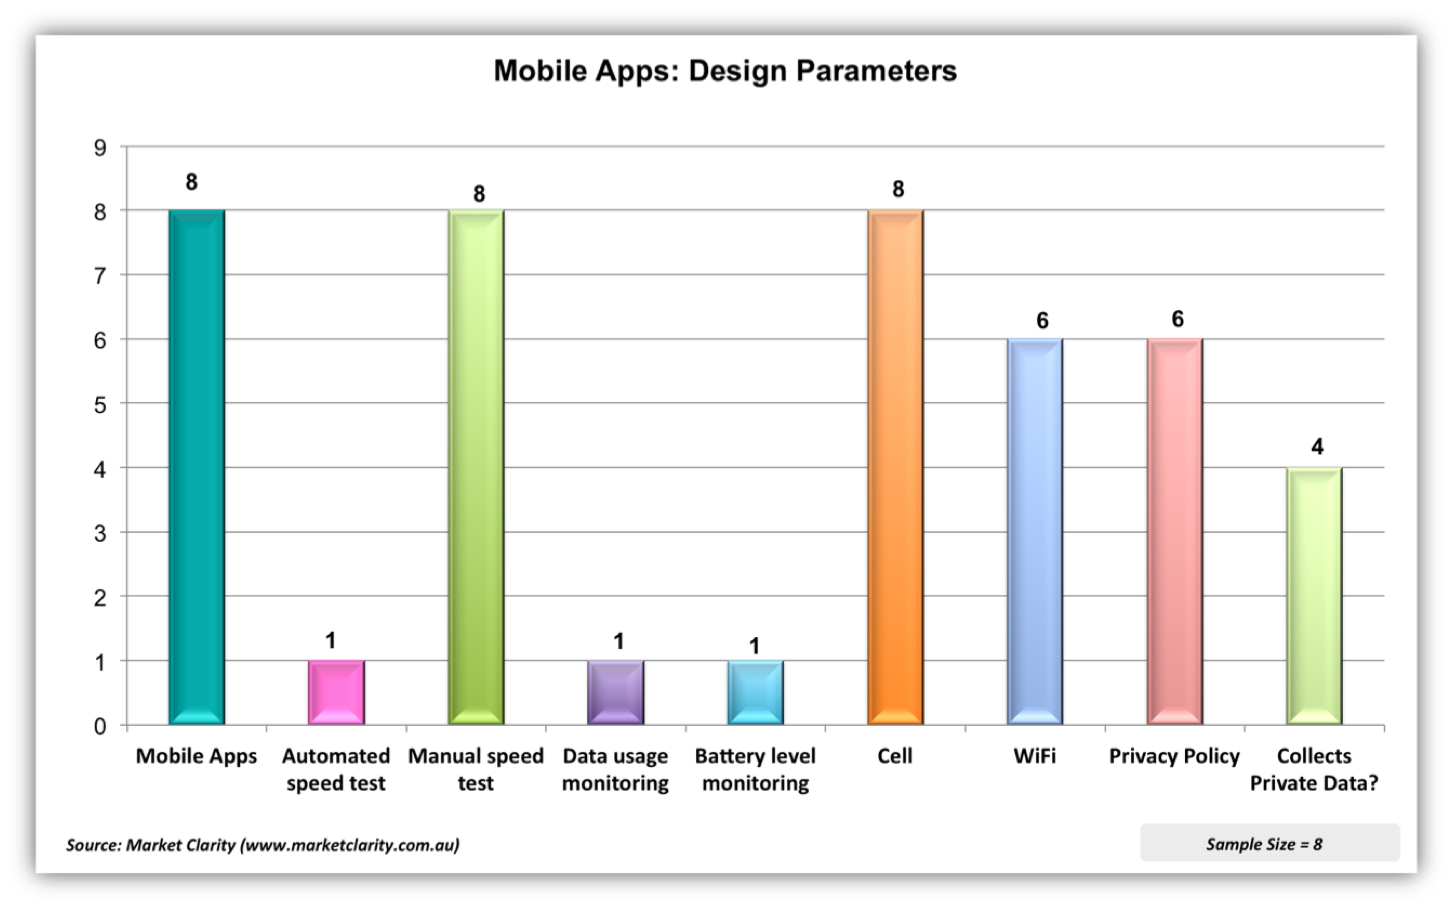
In Figure 7, we examine some of the design parameters used by the mobile network performance testing apps. As can be seen, only one app (Mobile Pulse) is able to do automated testing. Mobile Pulse is also the only app that includes battery usage and data usage thresholds (and monitoring).
Interestingly, all of the apps measure cellular network performance, but only six of them measure WiFi.
Six of the apps had a publicly available privacy policy. However, it would appear that half of the apps were actually collecting data such as IP addresses, SIM card information (phone number), unique handset identification numbers, and other personal identifiers. Given the geospatial tracking inherent in mobile network performance testing, this is particularly worrisome.
Figure 7 ? Examining Design Parameters used by Mobile Apps
Another aspect of the discussion on mobile network performance reporting has to do with the testing methodologies in use. It is beyond the scope of this paper to provide a complete discussion. However, to give you a view on some of the complexities inherent in network performance testing, and why you might get different results from different apps it is useful to provide a simple example.
One of the common design differences has to do with the number of parallel HTTP threads an app is using. If you were using a browser to access web-based information, the browser would typically use multiple threads. Therefore, a number of consumer-oriented apps use four parallel threads in their testing. By contrast, if you were downloading a document it would typically use a single thread. It depends on the target market as to which of these parameters a particular app designer might decide to use (or configure).
A further design consideration has to do with discarding data. Some of the apps examined for this paper discard anywhere from the 10 to 30 percent of sample outliers. But in doing so they're actually discarding valuable test results, which provide a view of how well the networks are performing.
To summarise, some key testing considerations include:
- Protocol: typically HTTP over TCP
- Upload / download file size and test length (impact on consumer mobile broadband plans)
- Number of upload and download threads (depends on type of application being emulated)
- Methodology for latency measurement
- Discarded data (can skew representation of consumer experience)
- Selection of speed test server
- Server availability
- Methodology to initiate test (manual or automatic)
As can be seen there are a large number of design factors that can impact mobile network performance measurement ? as well as factors such as fluctuating signal strength, interference, number of subscriber connections and device characteristics.
Work is currently being done within the IEEE 802.16.3 Mobile Broadband Network Performance Measurements committee (IEEE 2013) to develop standards that will specify procedures for characterising the performance of mobile broadband networks from a user perspective.
Examining US Federal, State and Local Government Mobile Broadband Performance Mapping Initiatives
In order to understand mapping options that may be useful in the Australian context, it?s useful to look at overseas initiatives.
In 2008, the US Federal Communications Commission (FCC) approved a broadband mapping plan to examine fixed and mobile broadband availability by speed. The US$293 million mapping project was part of a much larger project (US$7 billion) for a National Broadband Plan that had, among other goals, bringing high speed Internet service to rural areas. Commencing in February 2009, under the auspices of the National Telecommunications and Information Administration (NTIA), grants were awarded to the 50 States, 5 Territories, and the District of Columbia.
The program covers both fixed and mobile broadband, although the discussion in this paper will be limited to aspects pertaining to mobile broadband mapping.
Under the National Broadband Map (NBM) program (NTIA a)1, each grantee (US State or Territory) was able to design its own data collection and verification methodology as inputs into submitting the resulting maps and datasets back to the federal government for consolidation into a national map. The first maps were published in February 2011, and are updated on a six monthly basis (although it appears that the latest update reflects data current as of December 2012 (NTIA b).
As with most programs that allow this type of flexibility many different methodologies were used but they followed a similar trend. The first thing they would do is request information pertaining to network coverage and speeds from the service providers in their areas ? typically 3 to 6 mobile operators. Network information was generally provided in GIS shapefile format, Excel format, or a combination of formats. They would then correlate network data with US census blocks and create maps. The States would then try to validate the data through a variety of mechanisms, including drive tests, statistical modelling, crowdsourcing mobile network performance data, and purchasing data from the mobile app vendors that we discussed earlier in the paper. In addition to the federal mapping portal, each State also developed their own mapping portal, and they're all different ? surprise, surprise. Here are a few examples of the programs undertaken by the States.
- In addition to obtaining data from mobile operators, Utah utilised a drive testing validation methodology ? analysing results from six national carriers (UTAH BROADBAND a), (UTAH BROADBAND b). They drove over 6,000 miles ? gaining a snapshot in time of mobile broadband speeds, signal strength and technologies. After collection, the drive test data was used to assess operator data and was used in verification discussions with the mobile providers. It?s worth noting that every one of these carriers also conducts its own drive tests, but they don?t share this data because it's deemed to be proprietary.
- In California, they started with GIS or tabular data from the mobile operators, and then conducted their own statistical modelling (California PUC a ). Like other States, California obtains GIS coverage shapefiles from providers; or if not available tabular data containing tower and antenna information. Wireless parameters were used to model the service area, and from that create a shapefile. Individual radio unit specifications were used to measure performance based on frequency, transmit power, receiver sensitivity, antenna gain, and height. Signal coverage patterns were produced for each individual unit taking into account terrain and vegetation features that might hinder signal dispersion.
California also partnered with the California State University to develop the CalSPEED app (described earlier), and then paid students to do drive testing for them. In 2013, they also released a public crowd-sourced version of the app (California PUC b).
As can be seen from their website, California has a wide range of data that can be downloaded. In the April 2013 dataset (the latest available when researching this paper) the author was able to download a spreadsheet that contained 9,800 drive test samples, which contained a range of relevant information.
- Delaware also started their investigations with data requests to the mobile operators, but adopted a slightly different verification methodology (Delaware Broadband Project 2013). The State?s verification process included researching the providers? websites to verify that the advertised speeds on the websites were consistent with those documented by the providers as part of their submission to the State. In addition, the verification team made phone calls to some of the providers in order to further verify service availability and speeds. Following this process, the data was sent back to the providers for their review and acknowledgement of the data as being accurate.
After the original field verification testing done in 2010, further verification was done only on receipt of updated information from the providers in the State. For example, areas previously verified, which had no reported changes in technology or speed, were not re-verified as part of subsequent rounds of verification. In December 2012, State team members spent five days performing field verification functions ? testing cellular networks at 46 locations, conducting approximately 110 speed tests of cellular based wireless broadband provider networks.
Delaware also has a web-based speed test portal (Delaware Speed Test), which it encourages the public to use. However, it allowed the author to conduct a test from Australia across a DSL network, whilst allowing the author to indicate that the speed test was conducted via a mobile network. (The author sincerely hopes that this test result was discarded.) Furthermore, Delaware?s online mapping portal was not working properly on numerous occasions when the author examined the website (Delaware Interactive Map ).
- In addition to geospatial analysis and drive tests, a number of State governments are conducting large-scale crowdsourcing programs. Many, such as the State of Colorado, use Mobile Pulse because of its automated testing features.
Mobile Pulse has numerous data collection modes, including a crowd source privacy mode that doesn't collect any consumer data. States also deploy the application in an enterprise mode, using it in police cars, fire trucks and other government vehicles. This app is gaining a lot of traction with US Government entities because of the very large test samples obtained via automatic data collection.
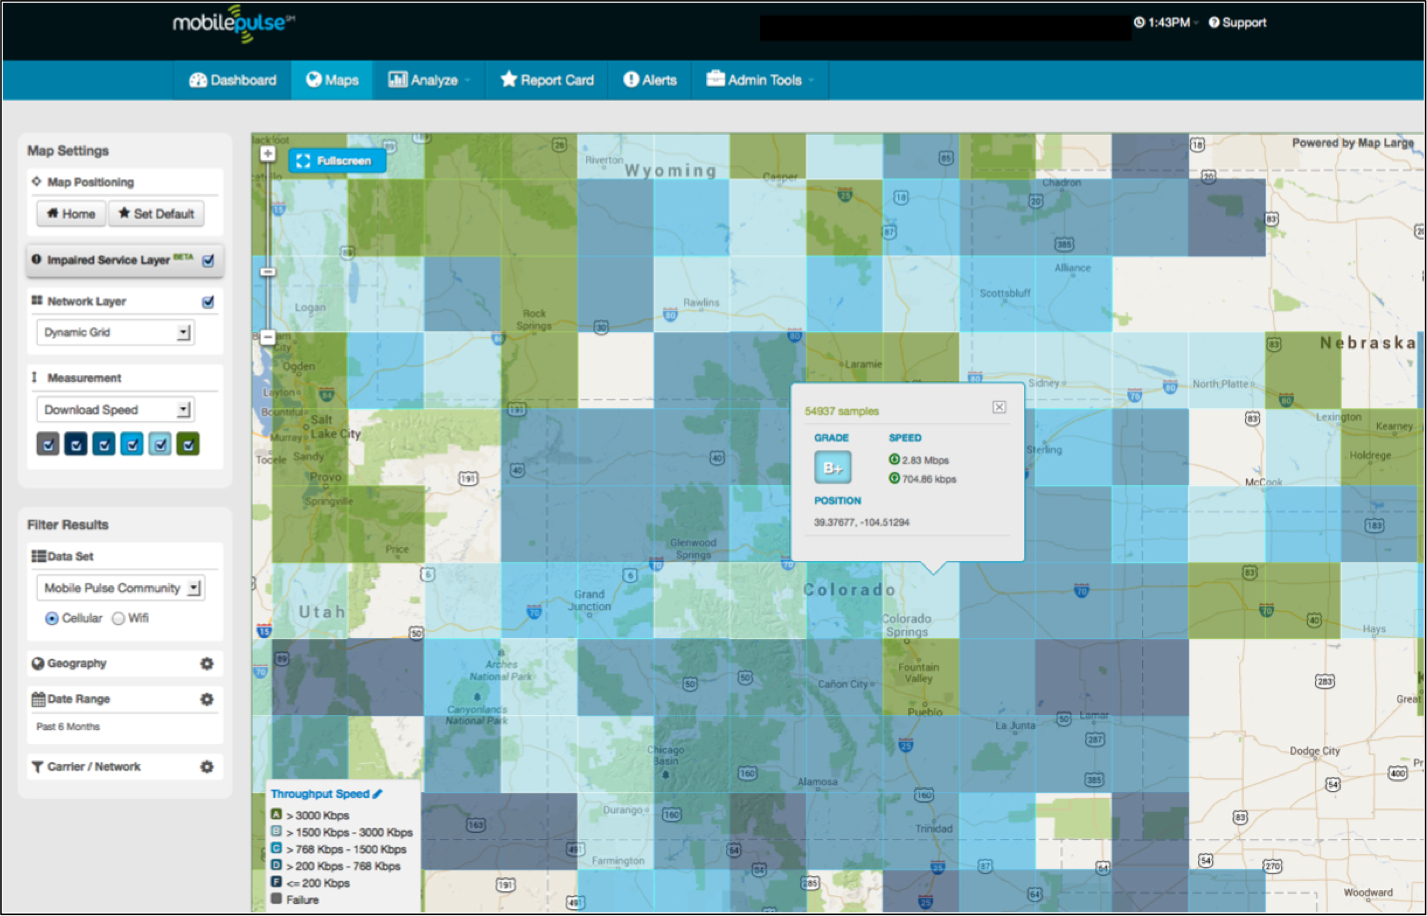
For example, Figure 8 shows Mobile Pulse testing in Colorado during a six-month period. In one small areas of the State (the light blue grid below the pop-up showing typical speeds) there were close to 55,000 test results. That's a large sample, especially when compared to the 9,800 drive tests that the author was able to download for the whole state of California during a similar six-month period.
US States are turning to crowdsourcing on a large scale, using automated test tools, because it generates a lot of data. Many of the large US drive testing companies have also deployed this app, running it in continuous data collection mode.
Figure 8 ? Mobile Pulse: Tests Conducted in Colorado (October 2013) (Mobile Pulse 2013)
There are many aspects of the US broadband mapping initiative that can be directly applied to similar programs in Australia and elsewhere. What is perhaps most interesting (although not surprising) is a view of speeds reported by the carriers versus the actual speeds recorded by the different States using a wide variety of methodologies.
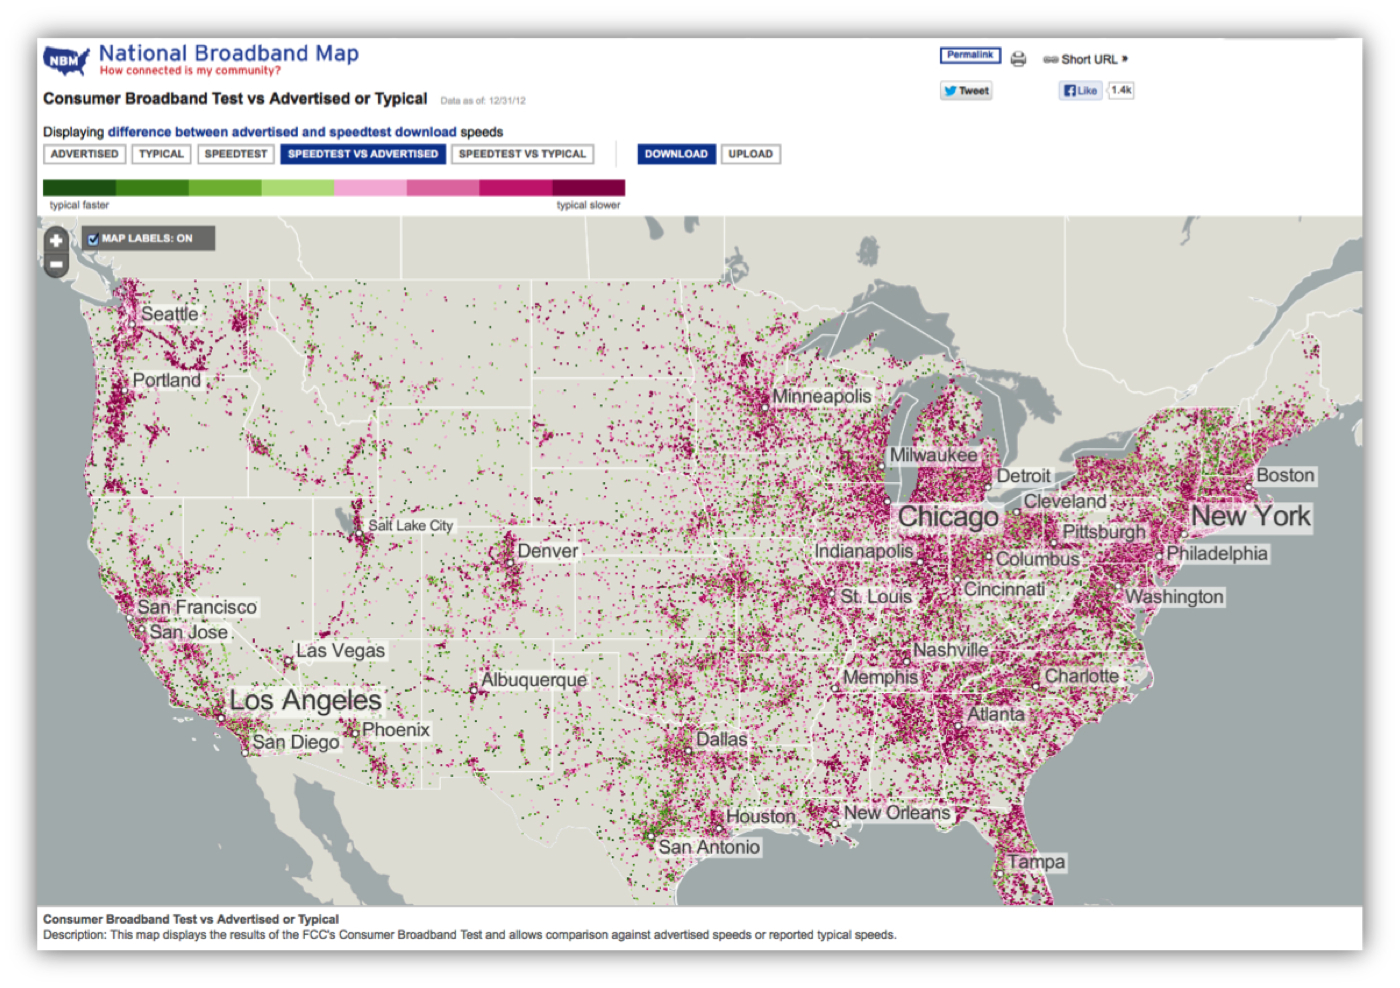
Figure 9, is from the US mapping portal (NTIA), and it shows a comparison of speed test results versus advertised speeds as reported by the carriers. Green dots indicate speeds that were faster than the carriers indicated, and red indicates slower speeds than the carriers reported.
Unfortunately, this Figure is not specific to mobile tests ? the mapping site doesn?t specify which technologies the result applies to, or allow selection by technology. However, this map provides an overall impression that the results of State testing produced results that tended to be slower than the advertised speeds. Although not show here, a similar map charting speed test results against typical speeds reported by carriers had a slightly more positive result in that there was a greater preponderance of green dots (faster results) on this map.
Figure 9 ? US National Broadband Map: Speedtest vs Advertised (All Technologies)
Concluding thoughts
In the US, the federal government provided grant funding for the States and Territories to collect and map fixed and mobile broadband performance data. A wide range of methodologies were used for this purpose ? including drive testing, data purchases (from mobile performance app vendors) and crowd source programs to correlate and map out real-world coverage in their area ? with the results stitched together into a national coverage map.
With respect to the varying methodologies in use, one can argue that this is good or bad. It certainly demonstrates that there is no single method in use in the US (or elsewhere in the world). From the perspective of providing a national map, it is this author?s view that a single methodology would have provided greater consistency in the national dataset, and would have eliminated duplication (and costs) affiliated with each State and Territory producing their own mapping portal in addition to the national mapping portal.
One of the interesting things, though, is that the mobile operators cooperated with the States. They provided GIS shapefiles and tabular data in Excel format, as well as a range of performance data ? usually showing theoretical speeds, rather than real world averages. Generally, because the States also provided the information back to the mobile operators, they found it a very useful cooperative process.
Could a similar program work in Australia? In this author?s view it could.
However, consumer privacy issues are really important, and this needs to be carefully considered in any program.
Consumer data usage and bill shock protection is another important issue. We wouldn't want to see millions of Australians download a mobile performance app onto their smartphone or tablet to help with a national crowdsourcing initiative, and end up with an unexpectedly large mobile service bill ? or find that they?ve used their full data allowance on the crowdsourcing initiative.
In this author?s view a large dataset is needed to provide a valid sample, and a large-scale crowdsourcing initiative could certainly provide this. Furthermore, automated, periodic testing at regular intervals (rather than manual speed tests) would provide results that are consistent with a typical consumer experience.
There are a number of methodology issues that remain unanswered. For instance, how do you represent data sets with variable results? Should any samples be discarded? If there is a large-enough dataset, using average (mean) or median results to represent typical upload and download speeds is certainly a valid way of representing mobile service performance expectations. By further segmenting the dataset by time of day, consumers would gain further useful information that could inform purchase decisions. And, mobile operators would gain useful insight into network performance from the perspective of an end user, with the myriad of devices deployed in the real world.
Having spent much of 2013 looking at this issue, it is this author?s view that consolidated mapping based solely on theoretical potential maximum speeds is not very useful. As shown in this paper, real world mobile network performance varies widely, and is also impacted by the measurement methodology in use. Nonetheless, a consolidated map that impartially shows real-world results from all of the mobile networks would provide some very useful information to consumers.
Would Australian mobile operators cooperate with this type of program? Maybe. To the extent that data is already published, it is likely to be made available to an analysis program.
The Australian Government has recently announced a $100m Mobile Coverage Programme (DoC 2013), which would require that each base station and group of base stations proposed for funding be assessed against a range of criteria. Certainly a crowd source mapping program would provide useful information to all parties, and assist in prioritising the specific geographic locations where funding would be applied.
References
Australian Communications and Media Authority. 2013. Reconnecting the Customer: Mobile Network Performance Forum, 14 November 2013. Available at http://www.acma.gov.au/theACMA/About/Events/Mobile-Network-Performance-Forum/mobile-network-performance-forum.
California Public Utilities Commission. nd. California Broadband Availability Maps and Data. Available at http://www.cpuc.ca.gov/PUC/Telco/Information+for+providing+service/Broadband+Availability+Maps.htm
California Public Utilities Commission. nd. " CPUC Unveils Mobile Speed Testing Application; Begins Round of Broadband Testing Throughout State". Available at http://www.cpuc.ca.gov/NEWSLETTER_IMAGES/0513ISSUE/CPUCeNewsletter_0513_full.html
Department of Communications, Australian Government. 2013 . Mobile Coverage Programme. Available at http://www.communications.gov.au/mobile_services/mobile_coverage_programme
Mobile Pulse. 2014. www.mobilepulse.com
Neville, Anne. 2011. Official FCC Blog. State Broadband Initiative ? NTIA, ?The National Broadband Map,? 17 February 2011. Available at http://www.fcc.gov/blog/national-broadband-map
U.S. Department of Commerce. nd. National Telecommunications and Information Administration. NTIA?s State Broadband Initiative, National Broadband Map. Available at www.broadbandmap.gov.
U.S. Department of Commerce. nd. National Telecommunications and Information Administration. NTIA?s State Broadband Initiative, National Broadband Map Datasets. Available at http://www2.ntia.doc.gov/broadband-data
Optus, Nov 2013, https://www.optus.com.au/network/mobile/coverage
State of Delaware. 2013. Broadband in Delaware - About the Project. Available at http://www.broadband.delaware.gov/about.shtml and Delaware Department of Technology and Information, Contract No. DTI-08-0013, Delaware Broadband Data and Development, Spring 2013 Data Submission White Paper (March 2013)
State of Delaware State of Delaware. 2011. Interactive Map. Available at http://www.broadband.delaware.gov/map.shtml
State of Delaware State of Delaware. nd. Internet Speed Test. Available at http://www.delawarespeedtest.com/
Telstra Corporation. 2013. See http://www.telstra.com.au/mobile-phones/coverage-networks/our-coverage/ (Nov 2013)
The State of Utah. nd. Broadband Project, About the Interactive Map. Available at http://broadband.utah.gov/about/about-the-interactive-map/
The State of Utah. nd. Broadband Project, Utah Mobile Broadband ?Drive Test? Data Available for Download, http://broadband.utah.gov/2011/10/13/utah-mobile-broadband-drive-test-data-available-for-download/ and http://broadband.utah.gov/map/
Vodafone. 2013. Coverage Checker Nov 2013 and Jan 2014. Available at http://www.vodafone.com.au/aboutvodafone/network/checker
Western Telecommunications Alliance. 2009. FCC Definition of broadband, as cited by Western Telecommunications Alliance to US Dept of Commerce, NTIA, American Recovery and Reinvestment Act of 2009 submission, April 2009.
Notes
- Information is available in both the mapping portal, as well as a range of file formats available for download (http://www.broadbandmap.gov/data-download). It appears, however, that the website does not support download requests coming from IP addresses outside of the US. In order to research this paper, colleagues in the US kindly downloaded relevant materials requested by the author, which was then supplemented with information directly available from each State or Territory?s broadband mapping portal.


